Costa Rican vs Somali 2nd Grade
COMPARE
Costa Rican
Somali
2nd Grade
2nd Grade Comparison
Costa Ricans
Somalis
97.7%
2ND GRADE
10.5/ 100
METRIC RATING
210th/ 347
METRIC RANK
97.0%
2ND GRADE
0.0/ 100
METRIC RATING
302nd/ 347
METRIC RANK
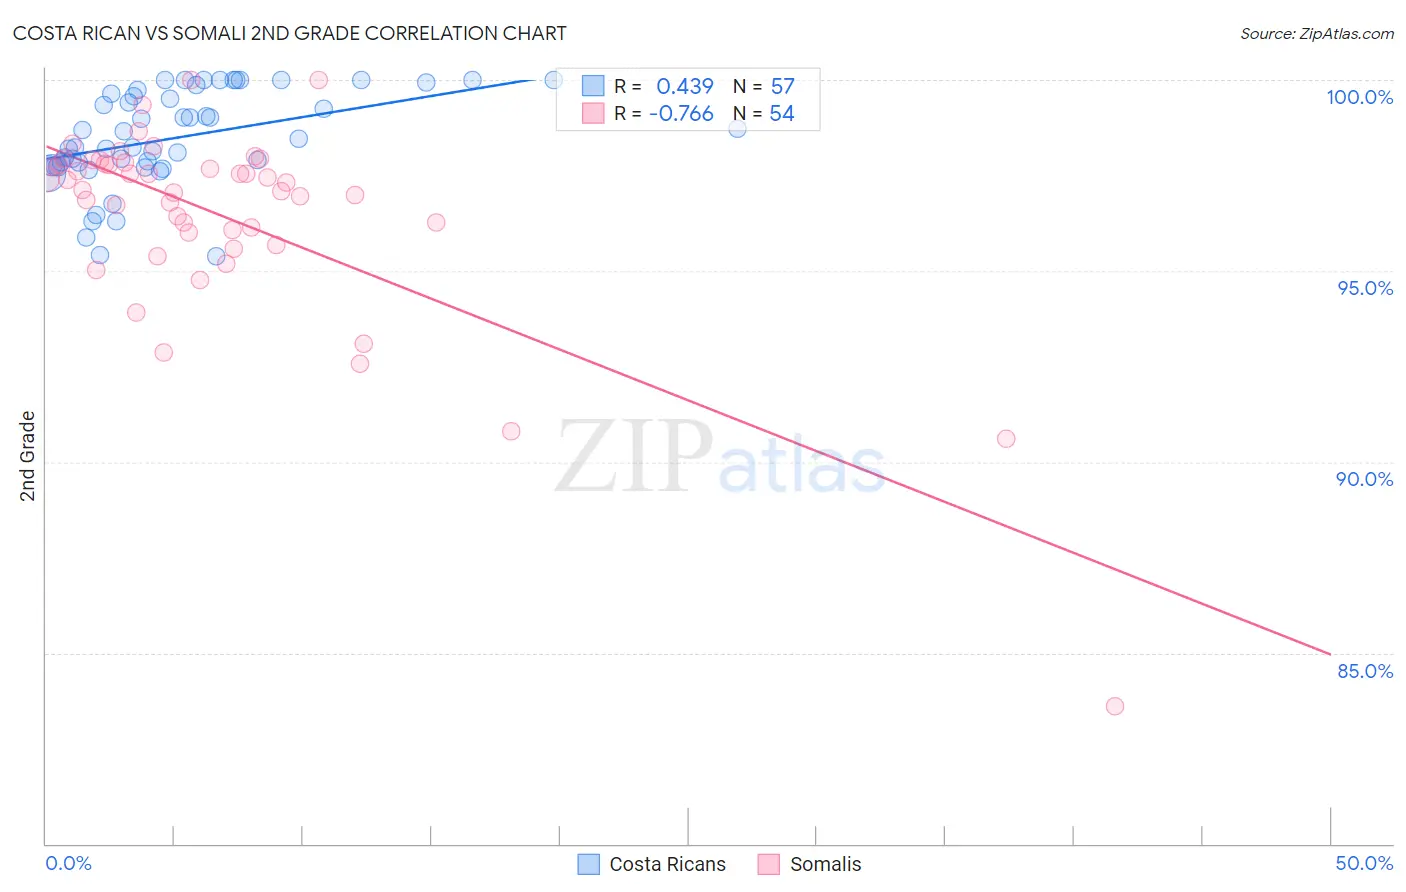
Costa Rican vs Somali 2nd Grade Correlation Chart
The statistical analysis conducted on geographies consisting of 253,599,979 people shows a moderate positive correlation between the proportion of Costa Ricans and percentage of population with at least 2nd grade education in the United States with a correlation coefficient (R) of 0.439 and weighted average of 97.7%. Similarly, the statistical analysis conducted on geographies consisting of 99,332,457 people shows a strong negative correlation between the proportion of Somalis and percentage of population with at least 2nd grade education in the United States with a correlation coefficient (R) of -0.766 and weighted average of 97.0%, a difference of 0.77%.
2nd Grade Correlation Summary
| Measurement | Costa Rican | Somali |
| Minimum | 95.4% | 83.6% |
| Maximum | 100.0% | 100.0% |
| Range | 4.6% | 16.4% |
| Mean | 98.5% | 96.4% |
| Median | 98.5% | 97.2% |
| Interquartile 25% (IQ1) | 97.8% | 96.0% |
| Interquartile 75% (IQ3) | 99.7% | 97.8% |
| Interquartile Range (IQR) | 1.9% | 1.8% |
| Standard Deviation (Sample) | 1.3% | 2.6% |
| Standard Deviation (Population) | 1.2% | 2.6% |
Similar Demographics by 2nd Grade
Demographics Similar to Costa Ricans by 2nd Grade
In terms of 2nd grade, the demographic groups most similar to Costa Ricans are Immigrants from Oceania (97.7%, a difference of 0.0%), Laotian (97.7%, a difference of 0.0%), Immigrants from Northern Africa (97.7%, a difference of 0.010%), Immigrants from Bahamas (97.7%, a difference of 0.020%), and Moroccan (97.7%, a difference of 0.020%).
| Demographics | Rating | Rank | 2nd Grade |
| Yuman | 20.0 /100 | #203 | Fair 97.8% |
| Immigrants | Albania | 18.4 /100 | #204 | Poor 97.8% |
| Immigrants | Southern Europe | 18.1 /100 | #205 | Poor 97.8% |
| Immigrants | Chile | 17.3 /100 | #206 | Poor 97.7% |
| Africans | 15.6 /100 | #207 | Poor 97.7% |
| Immigrants | Northern Africa | 12.3 /100 | #208 | Poor 97.7% |
| Immigrants | Oceania | 10.9 /100 | #209 | Poor 97.7% |
| Costa Ricans | 10.5 /100 | #210 | Poor 97.7% |
| Laotians | 9.9 /100 | #211 | Tragic 97.7% |
| Immigrants | Bahamas | 8.4 /100 | #212 | Tragic 97.7% |
| Moroccans | 8.2 /100 | #213 | Tragic 97.7% |
| Samoans | 7.1 /100 | #214 | Tragic 97.7% |
| Bahamians | 6.8 /100 | #215 | Tragic 97.7% |
| South American Indians | 6.7 /100 | #216 | Tragic 97.7% |
| Uruguayans | 6.2 /100 | #217 | Tragic 97.7% |
Demographics Similar to Somalis by 2nd Grade
In terms of 2nd grade, the demographic groups most similar to Somalis are Central American Indian (97.0%, a difference of 0.020%), Immigrants from South Eastern Asia (97.0%, a difference of 0.040%), Ecuadorian (96.9%, a difference of 0.040%), Immigrants from Caribbean (96.9%, a difference of 0.050%), and Immigrants from Cuba (97.0%, a difference of 0.060%).
| Demographics | Rating | Rank | 2nd Grade |
| Immigrants | Grenada | 0.0 /100 | #295 | Tragic 97.1% |
| Immigrants | Immigrants | 0.0 /100 | #296 | Tragic 97.1% |
| Immigrants | Cuba | 0.0 /100 | #297 | Tragic 97.0% |
| Immigrants | Dominica | 0.0 /100 | #298 | Tragic 97.0% |
| Haitians | 0.0 /100 | #299 | Tragic 97.0% |
| Immigrants | South Eastern Asia | 0.0 /100 | #300 | Tragic 97.0% |
| Central American Indians | 0.0 /100 | #301 | Tragic 97.0% |
| Somalis | 0.0 /100 | #302 | Tragic 97.0% |
| Ecuadorians | 0.0 /100 | #303 | Tragic 96.9% |
| Immigrants | Caribbean | 0.0 /100 | #304 | Tragic 96.9% |
| Nicaraguans | 0.0 /100 | #305 | Tragic 96.9% |
| Immigrants | Somalia | 0.0 /100 | #306 | Tragic 96.9% |
| Immigrants | Azores | 0.0 /100 | #307 | Tragic 96.8% |
| Immigrants | Haiti | 0.0 /100 | #308 | Tragic 96.8% |
| Belizeans | 0.0 /100 | #309 | Tragic 96.8% |