Comanche vs Bulgarian Female Poverty
COMPARE
Comanche
Bulgarian
Female Poverty
Female Poverty Comparison
Comanche
Bulgarians
16.2%
FEMALE POVERTY
0.0/ 100
METRIC RATING
285th/ 347
METRIC RANK
11.1%
FEMALE POVERTY
99.9/ 100
METRIC RATING
9th/ 347
METRIC RANK
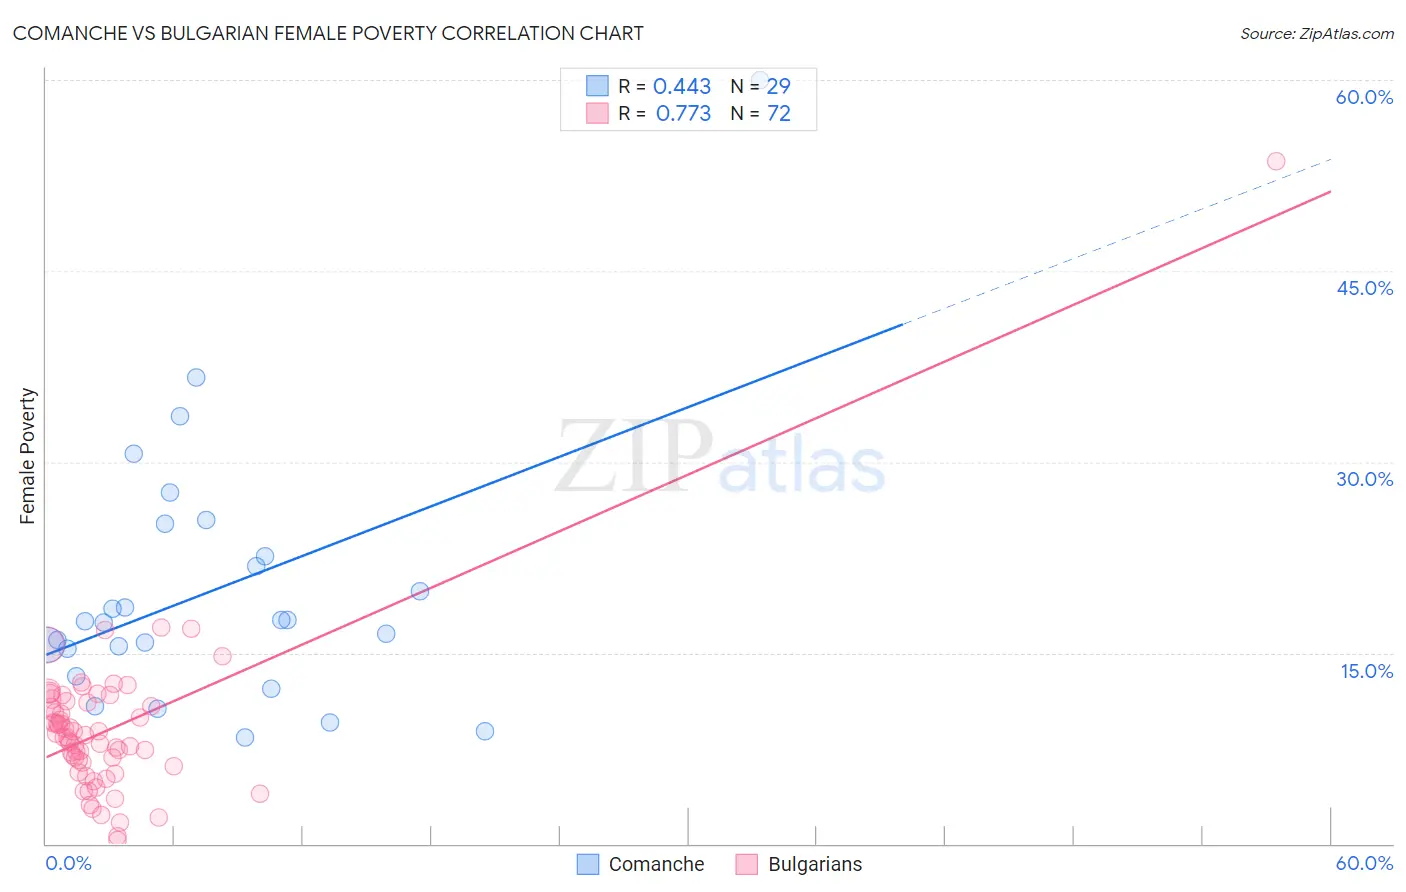
Comanche vs Bulgarian Female Poverty Correlation Chart
The statistical analysis conducted on geographies consisting of 109,749,855 people shows a moderate positive correlation between the proportion of Comanche and poverty level among females in the United States with a correlation coefficient (R) of 0.443 and weighted average of 16.2%. Similarly, the statistical analysis conducted on geographies consisting of 205,544,553 people shows a strong positive correlation between the proportion of Bulgarians and poverty level among females in the United States with a correlation coefficient (R) of 0.773 and weighted average of 11.1%, a difference of 45.3%.
Female Poverty Correlation Summary
| Measurement | Comanche | Bulgarian |
| Minimum | 8.4% | 0.25% |
| Maximum | 60.0% | 53.6% |
| Range | 51.6% | 53.3% |
| Mean | 20.0% | 9.0% |
| Median | 17.4% | 8.5% |
| Interquartile 25% (IQ1) | 14.3% | 6.2% |
| Interquartile 75% (IQ3) | 23.9% | 11.1% |
| Interquartile Range (IQR) | 9.6% | 4.9% |
| Standard Deviation (Sample) | 10.5% | 6.5% |
| Standard Deviation (Population) | 10.3% | 6.4% |
Similar Demographics by Female Poverty
Demographics Similar to Comanche by Female Poverty
In terms of female poverty, the demographic groups most similar to Comanche are Spanish American (16.2%, a difference of 0.080%), Immigrants from Cuba (16.1%, a difference of 0.13%), Immigrants from Haiti (16.1%, a difference of 0.21%), West Indian (16.1%, a difference of 0.36%), and Vietnamese (16.1%, a difference of 0.38%).
| Demographics | Rating | Rank | Female Poverty |
| Immigrants | West Indies | 0.0 /100 | #278 | Tragic 16.1% |
| Immigrants | Bahamas | 0.0 /100 | #279 | Tragic 16.1% |
| Vietnamese | 0.0 /100 | #280 | Tragic 16.1% |
| West Indians | 0.0 /100 | #281 | Tragic 16.1% |
| Immigrants | Haiti | 0.0 /100 | #282 | Tragic 16.1% |
| Immigrants | Cuba | 0.0 /100 | #283 | Tragic 16.1% |
| Spanish Americans | 0.0 /100 | #284 | Tragic 16.2% |
| Comanche | 0.0 /100 | #285 | Tragic 16.2% |
| Inupiat | 0.0 /100 | #286 | Tragic 16.2% |
| Immigrants | Belize | 0.0 /100 | #287 | Tragic 16.3% |
| Indonesians | 0.0 /100 | #288 | Tragic 16.4% |
| Blackfeet | 0.0 /100 | #289 | Tragic 16.4% |
| Immigrants | Bangladesh | 0.0 /100 | #290 | Tragic 16.4% |
| Yaqui | 0.0 /100 | #291 | Tragic 16.4% |
| Immigrants | Zaire | 0.0 /100 | #292 | Tragic 16.4% |
Demographics Similar to Bulgarians by Female Poverty
In terms of female poverty, the demographic groups most similar to Bulgarians are Immigrants from South Central Asia (11.1%, a difference of 0.19%), Immigrants from Hong Kong (11.2%, a difference of 0.80%), Assyrian/Chaldean/Syriac (11.0%, a difference of 0.89%), Maltese (11.2%, a difference of 0.91%), and Immigrants from Ireland (11.0%, a difference of 1.3%).
| Demographics | Rating | Rank | Female Poverty |
| Chinese | 100.0 /100 | #2 | Exceptional 10.4% |
| Thais | 100.0 /100 | #3 | Exceptional 10.5% |
| Immigrants | Taiwan | 100.0 /100 | #4 | Exceptional 10.5% |
| Filipinos | 100.0 /100 | #5 | Exceptional 10.9% |
| Immigrants | Ireland | 99.9 /100 | #6 | Exceptional 11.0% |
| Assyrians/Chaldeans/Syriacs | 99.9 /100 | #7 | Exceptional 11.0% |
| Immigrants | South Central Asia | 99.9 /100 | #8 | Exceptional 11.1% |
| Bulgarians | 99.9 /100 | #9 | Exceptional 11.1% |
| Immigrants | Hong Kong | 99.9 /100 | #10 | Exceptional 11.2% |
| Maltese | 99.9 /100 | #11 | Exceptional 11.2% |
| Bhutanese | 99.9 /100 | #12 | Exceptional 11.3% |
| Immigrants | Lithuania | 99.9 /100 | #13 | Exceptional 11.3% |
| Lithuanians | 99.8 /100 | #14 | Exceptional 11.4% |
| Latvians | 99.8 /100 | #15 | Exceptional 11.4% |
| Immigrants | Bolivia | 99.8 /100 | #16 | Exceptional 11.5% |