Comanche vs Iroquois Child Poverty Under the Age of 5
COMPARE
Comanche
Iroquois
Child Poverty Under the Age of 5
Child Poverty Under the Age of 5 Comparison
Comanche
Iroquois
21.0%
CHILD POVERTY UNDER THE AGE OF 5
0.0/ 100
METRIC RATING
283rd/ 347
METRIC RANK
22.0%
CHILD POVERTY UNDER THE AGE OF 5
0.0/ 100
METRIC RATING
302nd/ 347
METRIC RANK
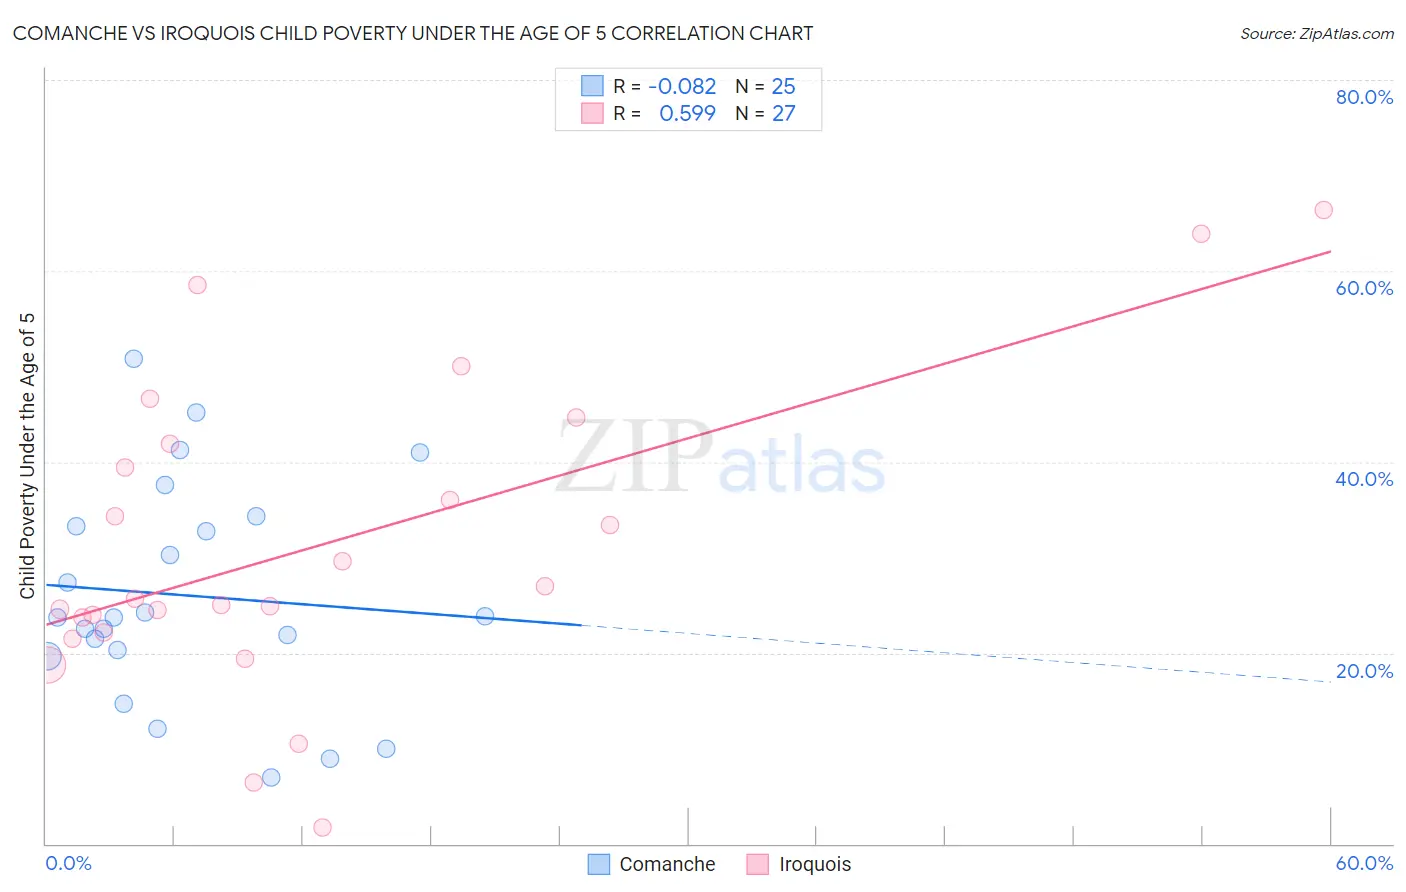
Comanche vs Iroquois Child Poverty Under the Age of 5 Correlation Chart
The statistical analysis conducted on geographies consisting of 108,975,573 people shows a slight negative correlation between the proportion of Comanche and poverty level among children under the age of 5 in the United States with a correlation coefficient (R) of -0.082 and weighted average of 21.0%. Similarly, the statistical analysis conducted on geographies consisting of 202,992,045 people shows a substantial positive correlation between the proportion of Iroquois and poverty level among children under the age of 5 in the United States with a correlation coefficient (R) of 0.599 and weighted average of 22.0%, a difference of 4.5%.
Child Poverty Under the Age of 5 Correlation Summary
| Measurement | Comanche | Iroquois |
| Minimum | 6.9% | 1.6% |
| Maximum | 50.7% | 66.3% |
| Range | 43.8% | 64.7% |
| Mean | 26.0% | 31.3% |
| Median | 23.8% | 25.7% |
| Interquartile 25% (IQ1) | 20.0% | 22.1% |
| Interquartile 75% (IQ3) | 33.8% | 41.9% |
| Interquartile Range (IQR) | 13.8% | 19.8% |
| Standard Deviation (Sample) | 11.5% | 16.1% |
| Standard Deviation (Population) | 11.2% | 15.8% |
Demographics Similar to Comanche and Iroquois by Child Poverty Under the Age of 5
In terms of child poverty under the age of 5, the demographic groups most similar to Comanche are Potawatomi (21.0%, a difference of 0.20%), Somali (21.1%, a difference of 0.33%), Haitian (21.2%, a difference of 0.80%), Immigrants from Latin America (21.2%, a difference of 0.88%), and Immigrants from Zaire (21.3%, a difference of 0.97%). Similarly, the demographic groups most similar to Iroquois are Immigrants from Central America (22.0%, a difference of 0.17%), Chickasaw (21.8%, a difference of 0.83%), Alaskan Athabascan (21.8%, a difference of 0.83%), Blackfeet (21.8%, a difference of 0.84%), and Hispanic or Latino (21.7%, a difference of 1.2%).
| Demographics | Rating | Rank | Child Poverty Under the Age of 5 |
| Potawatomi | 0.0 /100 | #282 | Tragic 21.0% |
| Comanche | 0.0 /100 | #283 | Tragic 21.0% |
| Somalis | 0.0 /100 | #284 | Tragic 21.1% |
| Haitians | 0.0 /100 | #285 | Tragic 21.2% |
| Immigrants | Latin America | 0.0 /100 | #286 | Tragic 21.2% |
| Immigrants | Zaire | 0.0 /100 | #287 | Tragic 21.3% |
| Immigrants | Senegal | 0.0 /100 | #288 | Tragic 21.3% |
| Immigrants | Haiti | 0.0 /100 | #289 | Tragic 21.3% |
| Immigrants | Caribbean | 0.0 /100 | #290 | Tragic 21.4% |
| British West Indians | 0.0 /100 | #291 | Tragic 21.4% |
| Immigrants | Somalia | 0.0 /100 | #292 | Tragic 21.6% |
| Mexicans | 0.0 /100 | #293 | Tragic 21.6% |
| Guatemalans | 0.0 /100 | #294 | Tragic 21.6% |
| Cherokee | 0.0 /100 | #295 | Tragic 21.7% |
| Yaqui | 0.0 /100 | #296 | Tragic 21.7% |
| Hispanics or Latinos | 0.0 /100 | #297 | Tragic 21.7% |
| Blackfeet | 0.0 /100 | #298 | Tragic 21.8% |
| Chickasaw | 0.0 /100 | #299 | Tragic 21.8% |
| Alaskan Athabascans | 0.0 /100 | #300 | Tragic 21.8% |
| Immigrants | Central America | 0.0 /100 | #301 | Tragic 22.0% |
| Iroquois | 0.0 /100 | #302 | Tragic 22.0% |