Comanche vs Cree Child Poverty Under the Age of 5
COMPARE
Comanche
Cree
Child Poverty Under the Age of 5
Child Poverty Under the Age of 5 Comparison
Comanche
Cree
21.0%
CHILD POVERTY UNDER THE AGE OF 5
0.0/ 100
METRIC RATING
283rd/ 347
METRIC RANK
19.7%
CHILD POVERTY UNDER THE AGE OF 5
0.4/ 100
METRIC RATING
246th/ 347
METRIC RANK
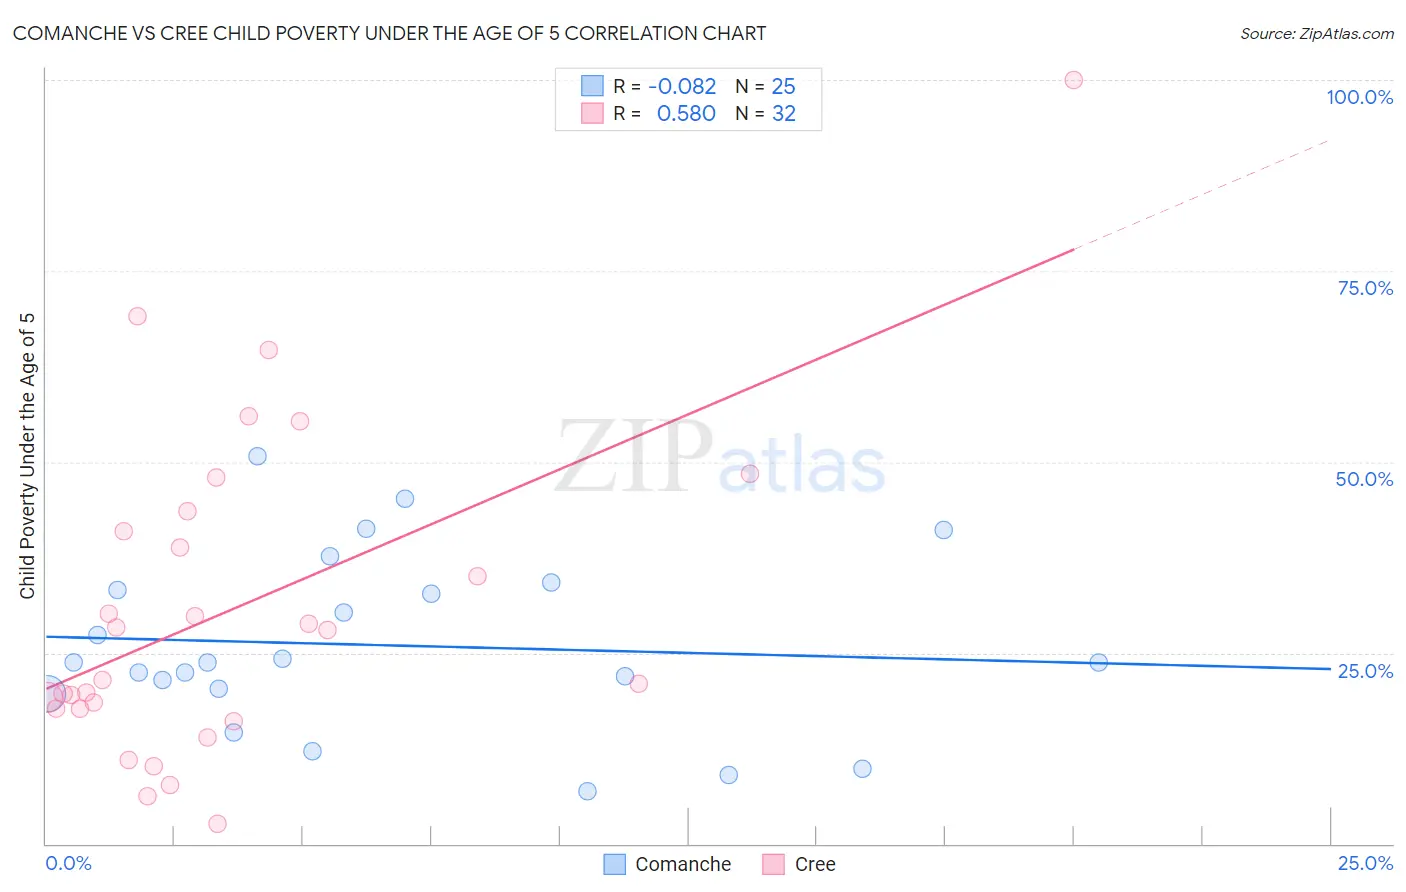
Comanche vs Cree Child Poverty Under the Age of 5 Correlation Chart
The statistical analysis conducted on geographies consisting of 108,975,573 people shows a slight negative correlation between the proportion of Comanche and poverty level among children under the age of 5 in the United States with a correlation coefficient (R) of -0.082 and weighted average of 21.0%. Similarly, the statistical analysis conducted on geographies consisting of 75,401,042 people shows a substantial positive correlation between the proportion of Cree and poverty level among children under the age of 5 in the United States with a correlation coefficient (R) of 0.580 and weighted average of 19.7%, a difference of 6.9%.
Child Poverty Under the Age of 5 Correlation Summary
| Measurement | Comanche | Cree |
| Minimum | 6.9% | 2.6% |
| Maximum | 50.7% | 100.0% |
| Range | 43.8% | 97.4% |
| Mean | 26.0% | 30.8% |
| Median | 23.8% | 24.7% |
| Interquartile 25% (IQ1) | 20.0% | 17.7% |
| Interquartile 75% (IQ3) | 33.8% | 42.2% |
| Interquartile Range (IQR) | 13.8% | 24.5% |
| Standard Deviation (Sample) | 11.5% | 21.3% |
| Standard Deviation (Population) | 11.2% | 20.9% |
Similar Demographics by Child Poverty Under the Age of 5
Demographics Similar to Comanche by Child Poverty Under the Age of 5
In terms of child poverty under the age of 5, the demographic groups most similar to Comanche are Potawatomi (21.0%, a difference of 0.20%), Somali (21.1%, a difference of 0.33%), Senegalese (20.9%, a difference of 0.74%), Haitian (21.2%, a difference of 0.80%), and Immigrants from Latin America (21.2%, a difference of 0.88%).
| Demographics | Rating | Rank | Child Poverty Under the Age of 5 |
| West Indians | 0.0 /100 | #276 | Tragic 20.6% |
| Immigrants | West Indies | 0.0 /100 | #277 | Tragic 20.7% |
| Immigrants | Grenada | 0.0 /100 | #278 | Tragic 20.7% |
| Sub-Saharan Africans | 0.0 /100 | #279 | Tragic 20.8% |
| French American Indians | 0.0 /100 | #280 | Tragic 20.8% |
| Senegalese | 0.0 /100 | #281 | Tragic 20.9% |
| Potawatomi | 0.0 /100 | #282 | Tragic 21.0% |
| Comanche | 0.0 /100 | #283 | Tragic 21.0% |
| Somalis | 0.0 /100 | #284 | Tragic 21.1% |
| Haitians | 0.0 /100 | #285 | Tragic 21.2% |
| Immigrants | Latin America | 0.0 /100 | #286 | Tragic 21.2% |
| Immigrants | Zaire | 0.0 /100 | #287 | Tragic 21.3% |
| Immigrants | Senegal | 0.0 /100 | #288 | Tragic 21.3% |
| Immigrants | Haiti | 0.0 /100 | #289 | Tragic 21.3% |
| Immigrants | Caribbean | 0.0 /100 | #290 | Tragic 21.4% |
Demographics Similar to Cree by Child Poverty Under the Age of 5
In terms of child poverty under the age of 5, the demographic groups most similar to Cree are Immigrants from Western Africa (19.7%, a difference of 0.070%), Guyanese (19.7%, a difference of 0.16%), Marshallese (19.7%, a difference of 0.17%), Immigrants from Middle Africa (19.7%, a difference of 0.19%), and Nonimmigrants (19.7%, a difference of 0.24%).
| Demographics | Rating | Rank | Child Poverty Under the Age of 5 |
| Vietnamese | 0.6 /100 | #239 | Tragic 19.5% |
| Immigrants | Ecuador | 0.5 /100 | #240 | Tragic 19.6% |
| Alaska Natives | 0.5 /100 | #241 | Tragic 19.6% |
| Immigrants | Guyana | 0.5 /100 | #242 | Tragic 19.6% |
| Osage | 0.5 /100 | #243 | Tragic 19.6% |
| Immigrants | Ghana | 0.5 /100 | #244 | Tragic 19.6% |
| Immigrants | Western Africa | 0.4 /100 | #245 | Tragic 19.7% |
| Cree | 0.4 /100 | #246 | Tragic 19.7% |
| Guyanese | 0.4 /100 | #247 | Tragic 19.7% |
| Marshallese | 0.4 /100 | #248 | Tragic 19.7% |
| Immigrants | Middle Africa | 0.4 /100 | #249 | Tragic 19.7% |
| Immigrants | Nonimmigrants | 0.4 /100 | #250 | Tragic 19.7% |
| Pennsylvania Germans | 0.3 /100 | #251 | Tragic 19.8% |
| Immigrants | Nicaragua | 0.3 /100 | #252 | Tragic 19.8% |
| Mexican American Indians | 0.3 /100 | #253 | Tragic 19.9% |