Chippewa vs Turkish Single Father Poverty
COMPARE
Chippewa
Turkish
Single Father Poverty
Single Father Poverty Comparison
Chippewa
Turks
18.8%
SINGLE FATHER POVERTY
0.0/ 100
METRIC RATING
310th/ 347
METRIC RANK
15.8%
SINGLE FATHER POVERTY
95.1/ 100
METRIC RATING
109th/ 347
METRIC RANK
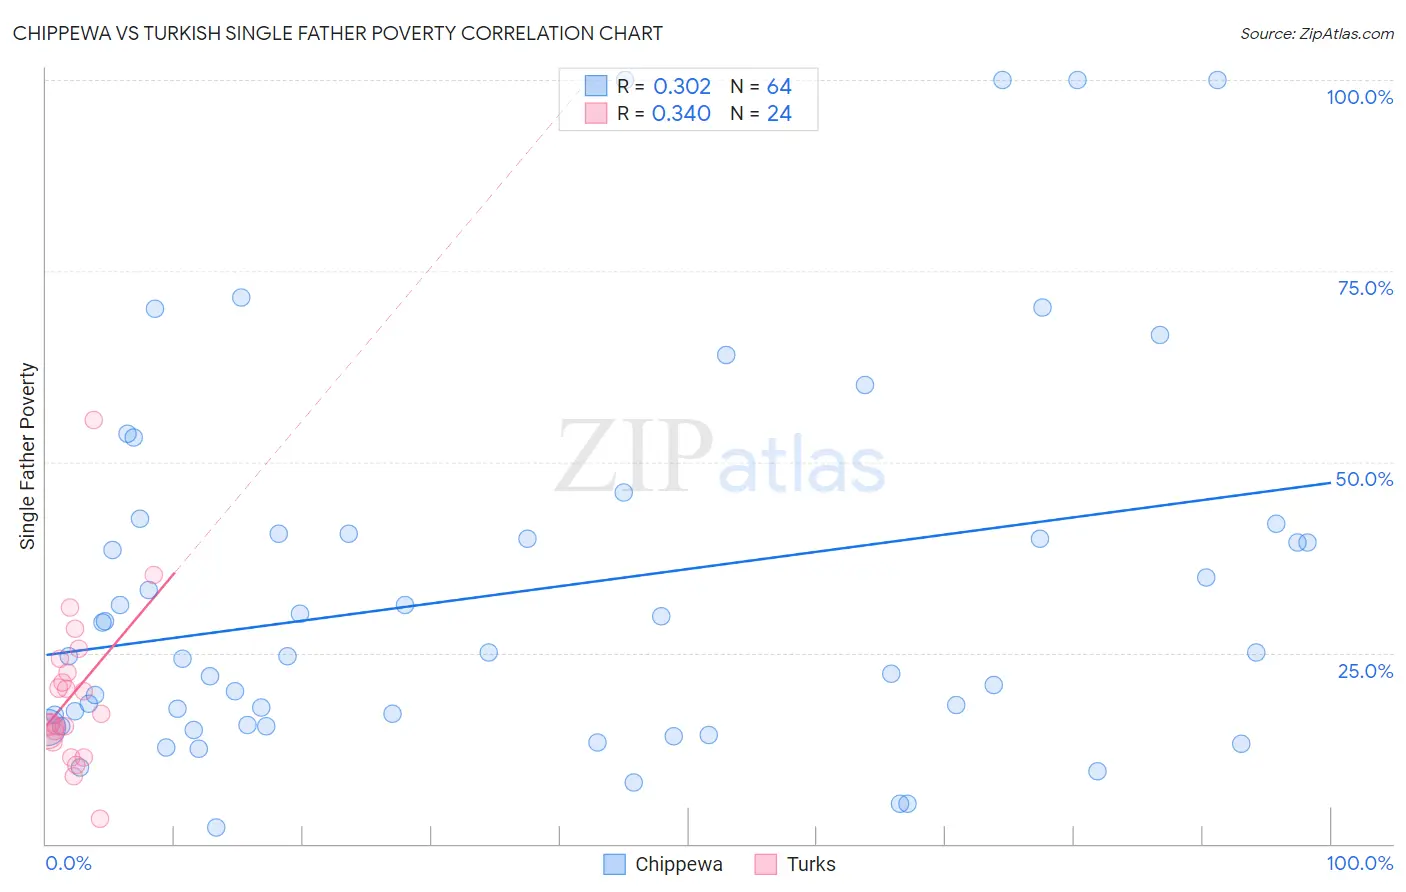
Chippewa vs Turkish Single Father Poverty Correlation Chart
The statistical analysis conducted on geographies consisting of 183,159,389 people shows a mild positive correlation between the proportion of Chippewa and poverty level among single fathers in the United States with a correlation coefficient (R) of 0.302 and weighted average of 18.8%. Similarly, the statistical analysis conducted on geographies consisting of 218,864,079 people shows a mild positive correlation between the proportion of Turks and poverty level among single fathers in the United States with a correlation coefficient (R) of 0.340 and weighted average of 15.8%, a difference of 19.3%.
Single Father Poverty Correlation Summary
| Measurement | Chippewa | Turkish |
| Minimum | 2.1% | 3.3% |
| Maximum | 100.0% | 55.4% |
| Range | 97.9% | 52.1% |
| Mean | 33.0% | 19.6% |
| Median | 24.8% | 16.4% |
| Interquartile 25% (IQ1) | 15.5% | 14.0% |
| Interquartile 75% (IQ3) | 40.6% | 23.4% |
| Interquartile Range (IQR) | 25.1% | 9.4% |
| Standard Deviation (Sample) | 24.4% | 10.5% |
| Standard Deviation (Population) | 24.2% | 10.3% |
Similar Demographics by Single Father Poverty
Demographics Similar to Chippewa by Single Father Poverty
In terms of single father poverty, the demographic groups most similar to Chippewa are Nonimmigrants (18.8%, a difference of 0.19%), Immigrants from Dominica (18.9%, a difference of 0.24%), Potawatomi (18.9%, a difference of 0.44%), Delaware (18.9%, a difference of 0.61%), and Chickasaw (19.0%, a difference of 0.76%).
| Demographics | Rating | Rank | Single Father Poverty |
| Celtics | 0.0 /100 | #303 | Tragic 18.5% |
| Ute | 0.0 /100 | #304 | Tragic 18.5% |
| Blackfeet | 0.0 /100 | #305 | Tragic 18.5% |
| Scotch-Irish | 0.0 /100 | #306 | Tragic 18.6% |
| French Canadians | 0.0 /100 | #307 | Tragic 18.6% |
| Ottawa | 0.0 /100 | #308 | Tragic 18.6% |
| Immigrants | Micronesia | 0.0 /100 | #309 | Tragic 18.6% |
| Chippewa | 0.0 /100 | #310 | Tragic 18.8% |
| Immigrants | Nonimmigrants | 0.0 /100 | #311 | Tragic 18.8% |
| Immigrants | Dominica | 0.0 /100 | #312 | Tragic 18.9% |
| Potawatomi | 0.0 /100 | #313 | Tragic 18.9% |
| Delaware | 0.0 /100 | #314 | Tragic 18.9% |
| Chickasaw | 0.0 /100 | #315 | Tragic 19.0% |
| Osage | 0.0 /100 | #316 | Tragic 19.0% |
| Dominicans | 0.0 /100 | #317 | Tragic 19.1% |
Demographics Similar to Turks by Single Father Poverty
In terms of single father poverty, the demographic groups most similar to Turks are Immigrants from Africa (15.8%, a difference of 0.010%), Bulgarian (15.8%, a difference of 0.060%), Immigrants from Latvia (15.8%, a difference of 0.090%), Danish (15.8%, a difference of 0.14%), and Argentinean (15.8%, a difference of 0.15%).
| Demographics | Rating | Rank | Single Father Poverty |
| Chileans | 96.4 /100 | #102 | Exceptional 15.7% |
| South American Indians | 96.2 /100 | #103 | Exceptional 15.7% |
| Australians | 96.1 /100 | #104 | Exceptional 15.7% |
| Immigrants | Australia | 96.1 /100 | #105 | Exceptional 15.7% |
| Immigrants | Poland | 95.8 /100 | #106 | Exceptional 15.7% |
| Native Hawaiians | 95.8 /100 | #107 | Exceptional 15.7% |
| Pakistanis | 95.7 /100 | #108 | Exceptional 15.7% |
| Turks | 95.1 /100 | #109 | Exceptional 15.8% |
| Immigrants | Africa | 95.1 /100 | #110 | Exceptional 15.8% |
| Bulgarians | 94.8 /100 | #111 | Exceptional 15.8% |
| Immigrants | Latvia | 94.7 /100 | #112 | Exceptional 15.8% |
| Danes | 94.5 /100 | #113 | Exceptional 15.8% |
| Argentineans | 94.4 /100 | #114 | Exceptional 15.8% |
| Immigrants | Thailand | 93.6 /100 | #115 | Exceptional 15.8% |
| Immigrants | Argentina | 92.8 /100 | #116 | Exceptional 15.8% |