Czechoslovakian vs Turkish Single Father Poverty
COMPARE
Czechoslovakian
Turkish
Single Father Poverty
Single Father Poverty Comparison
Czechoslovakians
Turks
17.1%
SINGLE FATHER POVERTY
1.3/ 100
METRIC RATING
248th/ 347
METRIC RANK
15.8%
SINGLE FATHER POVERTY
95.1/ 100
METRIC RATING
109th/ 347
METRIC RANK
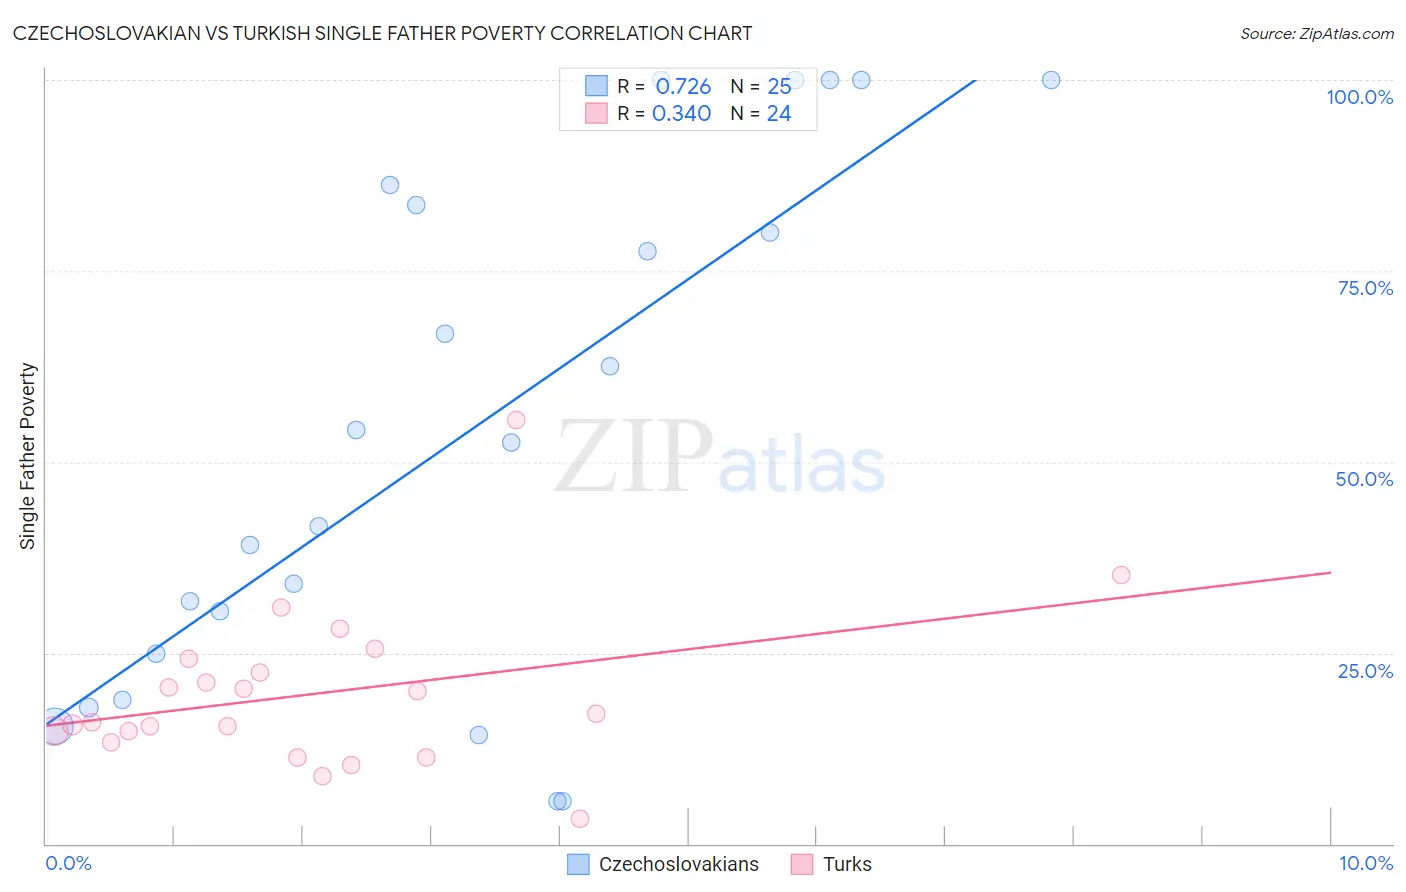
Czechoslovakian vs Turkish Single Father Poverty Correlation Chart
The statistical analysis conducted on geographies consisting of 285,091,389 people shows a strong positive correlation between the proportion of Czechoslovakians and poverty level among single fathers in the United States with a correlation coefficient (R) of 0.726 and weighted average of 17.1%. Similarly, the statistical analysis conducted on geographies consisting of 218,864,079 people shows a mild positive correlation between the proportion of Turks and poverty level among single fathers in the United States with a correlation coefficient (R) of 0.340 and weighted average of 15.8%, a difference of 8.3%.
Single Father Poverty Correlation Summary
| Measurement | Czechoslovakian | Turkish |
| Minimum | 5.5% | 3.3% |
| Maximum | 100.0% | 55.4% |
| Range | 94.5% | 52.1% |
| Mean | 53.7% | 19.6% |
| Median | 52.6% | 16.4% |
| Interquartile 25% (IQ1) | 21.8% | 14.0% |
| Interquartile 75% (IQ3) | 85.0% | 23.4% |
| Interquartile Range (IQR) | 63.1% | 9.4% |
| Standard Deviation (Sample) | 33.5% | 10.5% |
| Standard Deviation (Population) | 32.8% | 10.3% |
Similar Demographics by Single Father Poverty
Demographics Similar to Czechoslovakians by Single Father Poverty
In terms of single father poverty, the demographic groups most similar to Czechoslovakians are Greek (17.1%, a difference of 0.0%), Canadian (17.1%, a difference of 0.040%), Immigrants from Ireland (17.1%, a difference of 0.10%), Trinidadian and Tobagonian (17.0%, a difference of 0.14%), and Austrian (17.1%, a difference of 0.17%).
| Demographics | Rating | Rank | Single Father Poverty |
| Czechs | 2.3 /100 | #241 | Tragic 17.0% |
| Moroccans | 2.1 /100 | #242 | Tragic 17.0% |
| Immigrants | Cabo Verde | 1.6 /100 | #243 | Tragic 17.0% |
| Hondurans | 1.6 /100 | #244 | Tragic 17.0% |
| Trinidadians and Tobagonians | 1.5 /100 | #245 | Tragic 17.0% |
| Immigrants | Ireland | 1.4 /100 | #246 | Tragic 17.1% |
| Greeks | 1.3 /100 | #247 | Tragic 17.1% |
| Czechoslovakians | 1.3 /100 | #248 | Tragic 17.1% |
| Canadians | 1.3 /100 | #249 | Tragic 17.1% |
| Austrians | 1.1 /100 | #250 | Tragic 17.1% |
| Luxembourgers | 1.1 /100 | #251 | Tragic 17.1% |
| Croatians | 1.0 /100 | #252 | Tragic 17.1% |
| Cree | 1.0 /100 | #253 | Tragic 17.1% |
| Immigrants | Honduras | 0.9 /100 | #254 | Tragic 17.1% |
| Sierra Leoneans | 0.8 /100 | #255 | Tragic 17.2% |
Demographics Similar to Turks by Single Father Poverty
In terms of single father poverty, the demographic groups most similar to Turks are Immigrants from Africa (15.8%, a difference of 0.010%), Bulgarian (15.8%, a difference of 0.060%), Immigrants from Latvia (15.8%, a difference of 0.090%), Danish (15.8%, a difference of 0.14%), and Argentinean (15.8%, a difference of 0.15%).
| Demographics | Rating | Rank | Single Father Poverty |
| Chileans | 96.4 /100 | #102 | Exceptional 15.7% |
| South American Indians | 96.2 /100 | #103 | Exceptional 15.7% |
| Australians | 96.1 /100 | #104 | Exceptional 15.7% |
| Immigrants | Australia | 96.1 /100 | #105 | Exceptional 15.7% |
| Immigrants | Poland | 95.8 /100 | #106 | Exceptional 15.7% |
| Native Hawaiians | 95.8 /100 | #107 | Exceptional 15.7% |
| Pakistanis | 95.7 /100 | #108 | Exceptional 15.7% |
| Turks | 95.1 /100 | #109 | Exceptional 15.8% |
| Immigrants | Africa | 95.1 /100 | #110 | Exceptional 15.8% |
| Bulgarians | 94.8 /100 | #111 | Exceptional 15.8% |
| Immigrants | Latvia | 94.7 /100 | #112 | Exceptional 15.8% |
| Danes | 94.5 /100 | #113 | Exceptional 15.8% |
| Argentineans | 94.4 /100 | #114 | Exceptional 15.8% |
| Immigrants | Thailand | 93.6 /100 | #115 | Exceptional 15.8% |
| Immigrants | Argentina | 92.8 /100 | #116 | Exceptional 15.8% |