Chippewa vs Turkish In Labor Force | Age 25-29
COMPARE
Chippewa
Turkish
In Labor Force | Age 25-29
In Labor Force | Age 25-29 Comparison
Chippewa
Turks
82.9%
IN LABOR FORCE | AGE 25-29
0.0/ 100
METRIC RATING
295th/ 347
METRIC RANK
85.6%
IN LABOR FORCE | AGE 25-29
99.8/ 100
METRIC RATING
47th/ 347
METRIC RANK
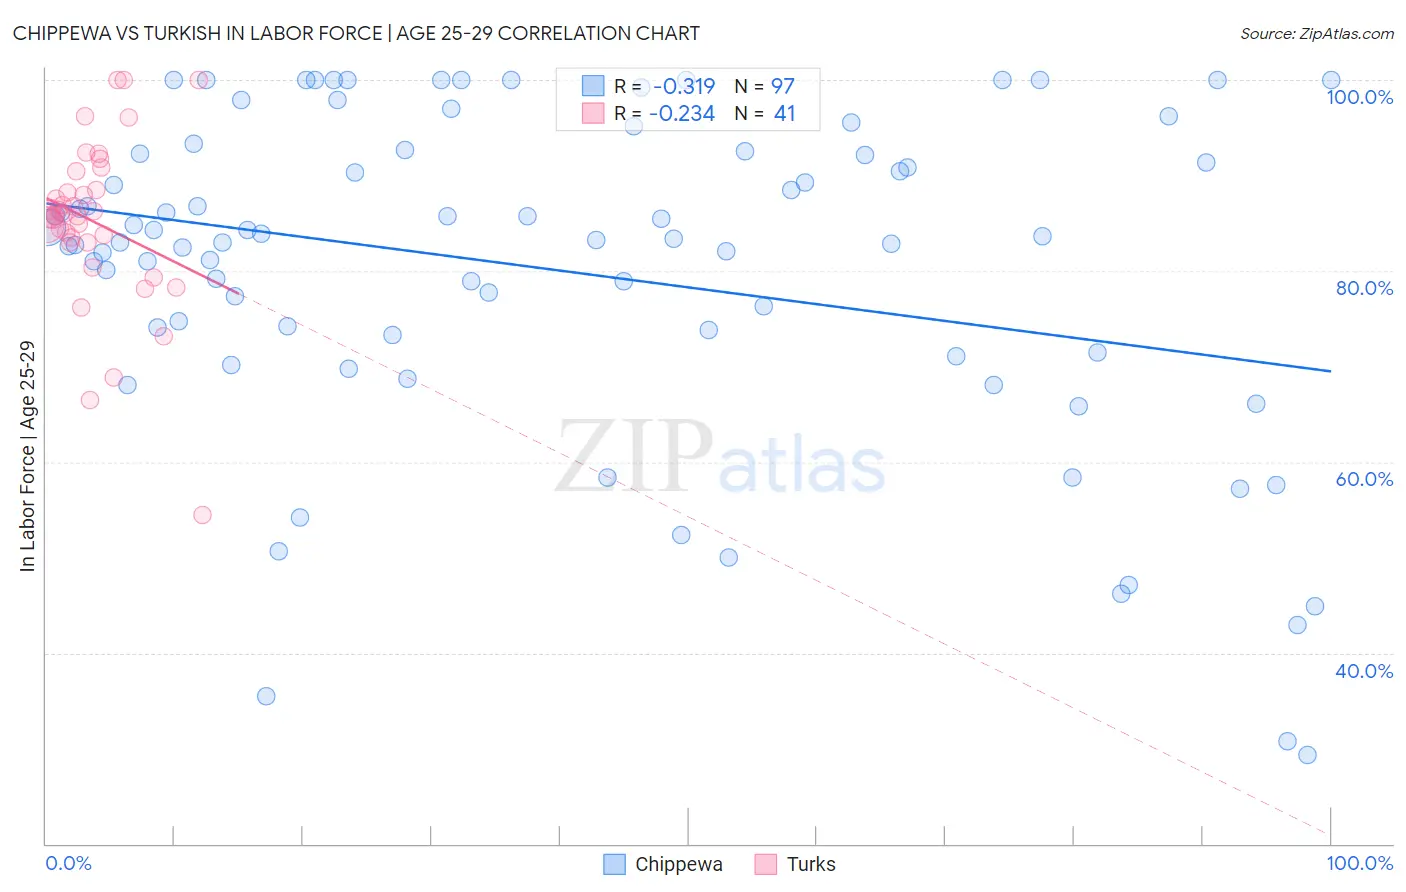
Chippewa vs Turkish In Labor Force | Age 25-29 Correlation Chart
The statistical analysis conducted on geographies consisting of 215,004,507 people shows a mild negative correlation between the proportion of Chippewa and labor force participation rate among population between the ages 25 and 29 in the United States with a correlation coefficient (R) of -0.319 and weighted average of 82.9%. Similarly, the statistical analysis conducted on geographies consisting of 271,804,418 people shows a weak negative correlation between the proportion of Turks and labor force participation rate among population between the ages 25 and 29 in the United States with a correlation coefficient (R) of -0.234 and weighted average of 85.6%, a difference of 3.3%.
In Labor Force | Age 25-29 Correlation Summary
| Measurement | Chippewa | Turkish |
| Minimum | 29.3% | 54.5% |
| Maximum | 100.0% | 100.0% |
| Range | 70.7% | 45.5% |
| Mean | 80.2% | 85.1% |
| Median | 83.3% | 85.8% |
| Interquartile 25% (IQ1) | 72.3% | 82.9% |
| Interquartile 75% (IQ3) | 92.4% | 89.5% |
| Interquartile Range (IQR) | 20.1% | 6.5% |
| Standard Deviation (Sample) | 17.1% | 8.8% |
| Standard Deviation (Population) | 17.0% | 8.7% |
Similar Demographics by In Labor Force | Age 25-29
Demographics Similar to Chippewa by In Labor Force | Age 25-29
In terms of in labor force | age 25-29, the demographic groups most similar to Chippewa are Nepalese (82.9%, a difference of 0.0%), Immigrants from Nicaragua (82.9%, a difference of 0.0%), Potawatomi (82.9%, a difference of 0.0%), Immigrants from Latin America (82.9%, a difference of 0.010%), and Native Hawaiian (82.9%, a difference of 0.020%).
| Demographics | Rating | Rank | In Labor Force | Age 25-29 |
| Ottawa | 0.0 /100 | #288 | Tragic 83.0% |
| Immigrants | Micronesia | 0.0 /100 | #289 | Tragic 83.0% |
| Immigrants | Bangladesh | 0.0 /100 | #290 | Tragic 83.0% |
| Hawaiians | 0.0 /100 | #291 | Tragic 83.0% |
| Immigrants | Guyana | 0.0 /100 | #292 | Tragic 83.0% |
| Immigrants | Latin America | 0.0 /100 | #293 | Tragic 82.9% |
| Nepalese | 0.0 /100 | #294 | Tragic 82.9% |
| Chippewa | 0.0 /100 | #295 | Tragic 82.9% |
| Immigrants | Nicaragua | 0.0 /100 | #296 | Tragic 82.9% |
| Potawatomi | 0.0 /100 | #297 | Tragic 82.9% |
| Native Hawaiians | 0.0 /100 | #298 | Tragic 82.9% |
| Fijians | 0.0 /100 | #299 | Tragic 82.9% |
| Spanish American Indians | 0.0 /100 | #300 | Tragic 82.9% |
| Vietnamese | 0.0 /100 | #301 | Tragic 82.8% |
| Immigrants | Belize | 0.0 /100 | #302 | Tragic 82.8% |
Demographics Similar to Turks by In Labor Force | Age 25-29
In terms of in labor force | age 25-29, the demographic groups most similar to Turks are Italian (85.6%, a difference of 0.0%), Czech (85.6%, a difference of 0.020%), Swedish (85.6%, a difference of 0.020%), Yugoslavian (85.6%, a difference of 0.040%), and Immigrants from Latvia (85.6%, a difference of 0.050%).
| Demographics | Rating | Rank | In Labor Force | Age 25-29 |
| Immigrants | Albania | 99.9 /100 | #40 | Exceptional 85.7% |
| Immigrants | Greece | 99.9 /100 | #41 | Exceptional 85.7% |
| Immigrants | Eritrea | 99.9 /100 | #42 | Exceptional 85.7% |
| Immigrants | India | 99.9 /100 | #43 | Exceptional 85.7% |
| Macedonians | 99.9 /100 | #44 | Exceptional 85.7% |
| Immigrants | Sierra Leone | 99.9 /100 | #45 | Exceptional 85.7% |
| Czechs | 99.8 /100 | #46 | Exceptional 85.6% |
| Turks | 99.8 /100 | #47 | Exceptional 85.6% |
| Italians | 99.8 /100 | #48 | Exceptional 85.6% |
| Swedes | 99.8 /100 | #49 | Exceptional 85.6% |
| Yugoslavians | 99.8 /100 | #50 | Exceptional 85.6% |
| Immigrants | Latvia | 99.8 /100 | #51 | Exceptional 85.6% |
| Immigrants | Poland | 99.7 /100 | #52 | Exceptional 85.6% |
| Belgians | 99.7 /100 | #53 | Exceptional 85.5% |
| Albanians | 99.7 /100 | #54 | Exceptional 85.5% |