Chippewa vs British West Indian Single Father Poverty
COMPARE
Chippewa
British West Indian
Single Father Poverty
Single Father Poverty Comparison
Chippewa
British West Indians
18.8%
SINGLE FATHER POVERTY
0.0/ 100
METRIC RATING
310th/ 347
METRIC RANK
17.7%
SINGLE FATHER POVERTY
0.0/ 100
METRIC RATING
275th/ 347
METRIC RANK
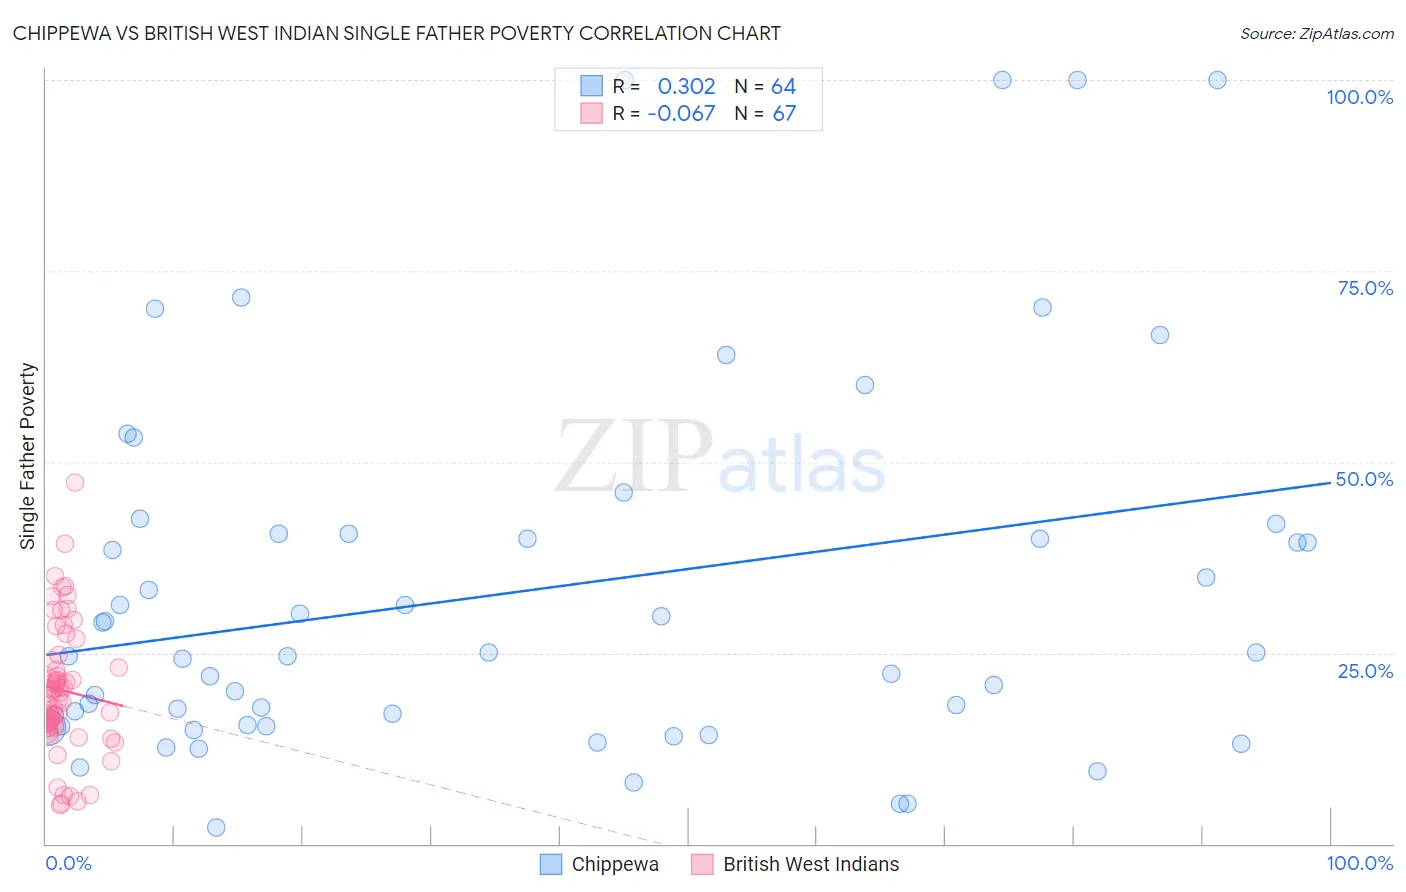
Chippewa vs British West Indian Single Father Poverty Correlation Chart
The statistical analysis conducted on geographies consisting of 183,159,389 people shows a mild positive correlation between the proportion of Chippewa and poverty level among single fathers in the United States with a correlation coefficient (R) of 0.302 and weighted average of 18.8%. Similarly, the statistical analysis conducted on geographies consisting of 135,730,694 people shows a slight negative correlation between the proportion of British West Indians and poverty level among single fathers in the United States with a correlation coefficient (R) of -0.067 and weighted average of 17.7%, a difference of 6.4%.
Single Father Poverty Correlation Summary
| Measurement | Chippewa | British West Indian |
| Minimum | 2.1% | 5.0% |
| Maximum | 100.0% | 47.4% |
| Range | 97.9% | 42.3% |
| Mean | 33.0% | 20.1% |
| Median | 24.8% | 19.7% |
| Interquartile 25% (IQ1) | 15.5% | 15.3% |
| Interquartile 75% (IQ3) | 40.6% | 24.0% |
| Interquartile Range (IQR) | 25.1% | 8.7% |
| Standard Deviation (Sample) | 24.4% | 8.5% |
| Standard Deviation (Population) | 24.2% | 8.4% |
Similar Demographics by Single Father Poverty
Demographics Similar to Chippewa by Single Father Poverty
In terms of single father poverty, the demographic groups most similar to Chippewa are Nonimmigrants (18.8%, a difference of 0.19%), Immigrants from Dominica (18.9%, a difference of 0.24%), Potawatomi (18.9%, a difference of 0.44%), Delaware (18.9%, a difference of 0.61%), and Chickasaw (19.0%, a difference of 0.76%).
| Demographics | Rating | Rank | Single Father Poverty |
| Celtics | 0.0 /100 | #303 | Tragic 18.5% |
| Ute | 0.0 /100 | #304 | Tragic 18.5% |
| Blackfeet | 0.0 /100 | #305 | Tragic 18.5% |
| Scotch-Irish | 0.0 /100 | #306 | Tragic 18.6% |
| French Canadians | 0.0 /100 | #307 | Tragic 18.6% |
| Ottawa | 0.0 /100 | #308 | Tragic 18.6% |
| Immigrants | Micronesia | 0.0 /100 | #309 | Tragic 18.6% |
| Chippewa | 0.0 /100 | #310 | Tragic 18.8% |
| Immigrants | Nonimmigrants | 0.0 /100 | #311 | Tragic 18.8% |
| Immigrants | Dominica | 0.0 /100 | #312 | Tragic 18.9% |
| Potawatomi | 0.0 /100 | #313 | Tragic 18.9% |
| Delaware | 0.0 /100 | #314 | Tragic 18.9% |
| Chickasaw | 0.0 /100 | #315 | Tragic 19.0% |
| Osage | 0.0 /100 | #316 | Tragic 19.0% |
| Dominicans | 0.0 /100 | #317 | Tragic 19.1% |
Demographics Similar to British West Indians by Single Father Poverty
In terms of single father poverty, the demographic groups most similar to British West Indians are German Russian (17.7%, a difference of 0.060%), Macedonian (17.7%, a difference of 0.070%), Lebanese (17.7%, a difference of 0.21%), German (17.7%, a difference of 0.22%), and Iroquois (17.7%, a difference of 0.37%).
| Demographics | Rating | Rank | Single Father Poverty |
| Immigrants | Caribbean | 0.3 /100 | #268 | Tragic 17.4% |
| Slavs | 0.3 /100 | #269 | Tragic 17.4% |
| Indonesians | 0.2 /100 | #270 | Tragic 17.4% |
| French American Indians | 0.2 /100 | #271 | Tragic 17.4% |
| Barbadians | 0.1 /100 | #272 | Tragic 17.5% |
| Italians | 0.1 /100 | #273 | Tragic 17.5% |
| Macedonians | 0.1 /100 | #274 | Tragic 17.7% |
| British West Indians | 0.0 /100 | #275 | Tragic 17.7% |
| German Russians | 0.0 /100 | #276 | Tragic 17.7% |
| Lebanese | 0.0 /100 | #277 | Tragic 17.7% |
| Germans | 0.0 /100 | #278 | Tragic 17.7% |
| Iroquois | 0.0 /100 | #279 | Tragic 17.7% |
| Scottish | 0.0 /100 | #280 | Tragic 17.7% |
| English | 0.0 /100 | #281 | Tragic 17.8% |
| Dutch | 0.0 /100 | #282 | Tragic 17.8% |