Chippewa vs Immigrants from Vietnam Single Father Poverty
COMPARE
Chippewa
Immigrants from Vietnam
Single Father Poverty
Single Father Poverty Comparison
Chippewa
Immigrants from Vietnam
18.8%
SINGLE FATHER POVERTY
0.0/ 100
METRIC RATING
310th/ 347
METRIC RANK
14.1%
SINGLE FATHER POVERTY
100.0/ 100
METRIC RATING
14th/ 347
METRIC RANK
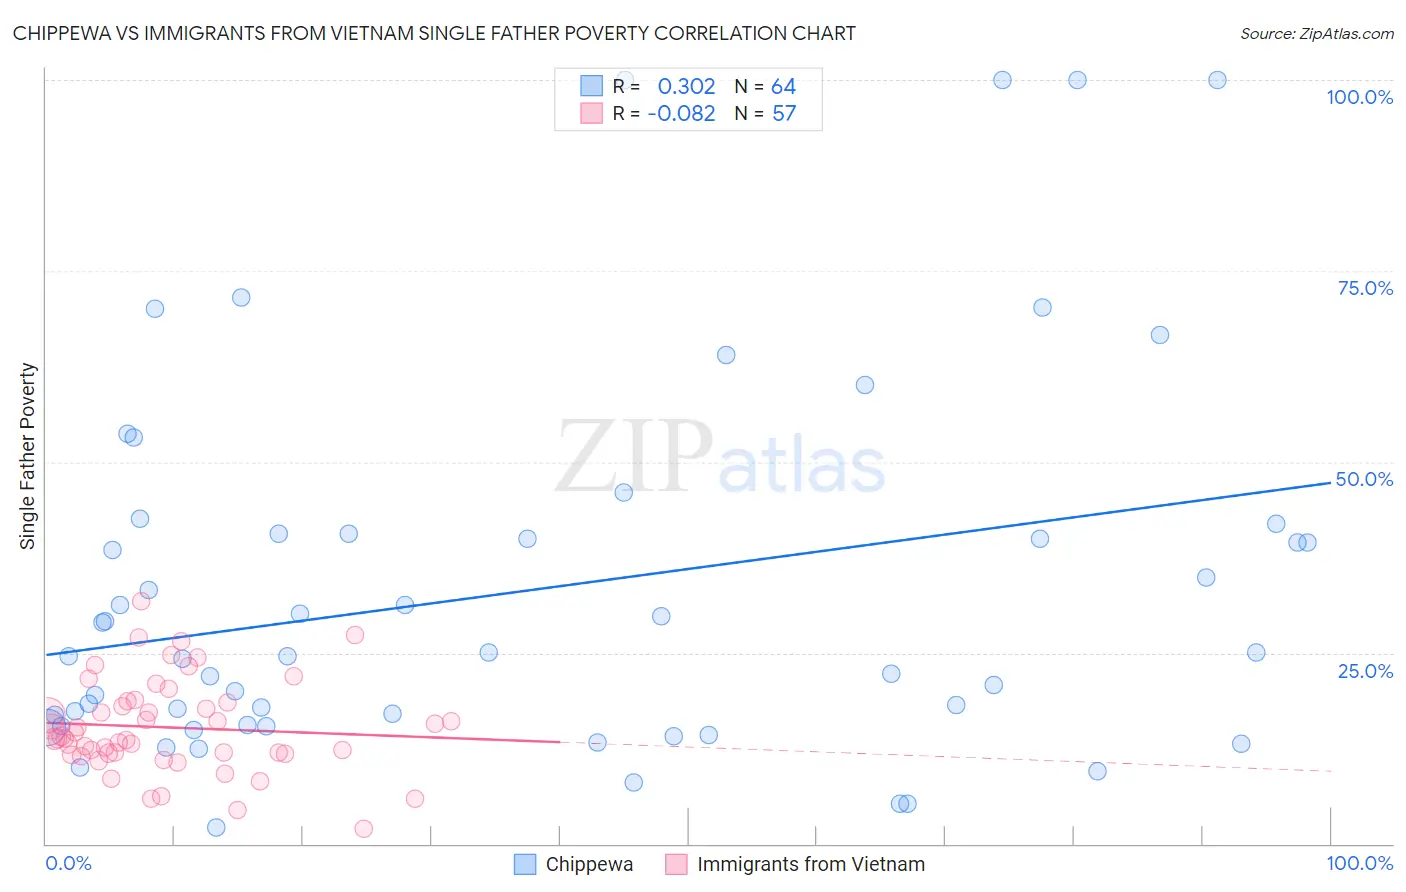
Chippewa vs Immigrants from Vietnam Single Father Poverty Correlation Chart
The statistical analysis conducted on geographies consisting of 183,159,389 people shows a mild positive correlation between the proportion of Chippewa and poverty level among single fathers in the United States with a correlation coefficient (R) of 0.302 and weighted average of 18.8%. Similarly, the statistical analysis conducted on geographies consisting of 320,936,660 people shows a slight negative correlation between the proportion of Immigrants from Vietnam and poverty level among single fathers in the United States with a correlation coefficient (R) of -0.082 and weighted average of 14.1%, a difference of 33.0%.
Single Father Poverty Correlation Summary
| Measurement | Chippewa | Immigrants from Vietnam |
| Minimum | 2.1% | 2.0% |
| Maximum | 100.0% | 31.8% |
| Range | 97.9% | 29.8% |
| Mean | 33.0% | 15.2% |
| Median | 24.8% | 13.8% |
| Interquartile 25% (IQ1) | 15.5% | 11.8% |
| Interquartile 75% (IQ3) | 40.6% | 18.5% |
| Interquartile Range (IQR) | 25.1% | 6.7% |
| Standard Deviation (Sample) | 24.4% | 6.1% |
| Standard Deviation (Population) | 24.2% | 6.0% |
Similar Demographics by Single Father Poverty
Demographics Similar to Chippewa by Single Father Poverty
In terms of single father poverty, the demographic groups most similar to Chippewa are Nonimmigrants (18.8%, a difference of 0.19%), Immigrants from Dominica (18.9%, a difference of 0.24%), Potawatomi (18.9%, a difference of 0.44%), Delaware (18.9%, a difference of 0.61%), and Chickasaw (19.0%, a difference of 0.76%).
| Demographics | Rating | Rank | Single Father Poverty |
| Celtics | 0.0 /100 | #303 | Tragic 18.5% |
| Ute | 0.0 /100 | #304 | Tragic 18.5% |
| Blackfeet | 0.0 /100 | #305 | Tragic 18.5% |
| Scotch-Irish | 0.0 /100 | #306 | Tragic 18.6% |
| French Canadians | 0.0 /100 | #307 | Tragic 18.6% |
| Ottawa | 0.0 /100 | #308 | Tragic 18.6% |
| Immigrants | Micronesia | 0.0 /100 | #309 | Tragic 18.6% |
| Chippewa | 0.0 /100 | #310 | Tragic 18.8% |
| Immigrants | Nonimmigrants | 0.0 /100 | #311 | Tragic 18.8% |
| Immigrants | Dominica | 0.0 /100 | #312 | Tragic 18.9% |
| Potawatomi | 0.0 /100 | #313 | Tragic 18.9% |
| Delaware | 0.0 /100 | #314 | Tragic 18.9% |
| Chickasaw | 0.0 /100 | #315 | Tragic 19.0% |
| Osage | 0.0 /100 | #316 | Tragic 19.0% |
| Dominicans | 0.0 /100 | #317 | Tragic 19.1% |
Demographics Similar to Immigrants from Vietnam by Single Father Poverty
In terms of single father poverty, the demographic groups most similar to Immigrants from Vietnam are Sri Lankan (14.2%, a difference of 0.050%), Immigrants from Iran (14.2%, a difference of 0.26%), Immigrants from Philippines (14.0%, a difference of 0.70%), Immigrants from Hong Kong (14.2%, a difference of 0.71%), and Soviet Union (14.3%, a difference of 0.74%).
| Demographics | Rating | Rank | Single Father Poverty |
| Immigrants | Taiwan | 100.0 /100 | #7 | Exceptional 13.7% |
| Samoans | 100.0 /100 | #8 | Exceptional 13.8% |
| Afghans | 100.0 /100 | #9 | Exceptional 14.0% |
| Koreans | 100.0 /100 | #10 | Exceptional 14.0% |
| Filipinos | 100.0 /100 | #11 | Exceptional 14.0% |
| Immigrants | India | 100.0 /100 | #12 | Exceptional 14.0% |
| Immigrants | Philippines | 100.0 /100 | #13 | Exceptional 14.0% |
| Immigrants | Vietnam | 100.0 /100 | #14 | Exceptional 14.1% |
| Sri Lankans | 100.0 /100 | #15 | Exceptional 14.2% |
| Immigrants | Iran | 100.0 /100 | #16 | Exceptional 14.2% |
| Immigrants | Hong Kong | 100.0 /100 | #17 | Exceptional 14.2% |
| Soviet Union | 100.0 /100 | #18 | Exceptional 14.3% |
| Immigrants | Iraq | 100.0 /100 | #19 | Exceptional 14.3% |
| Immigrants | Singapore | 100.0 /100 | #20 | Exceptional 14.3% |
| Immigrants | Afghanistan | 100.0 /100 | #21 | Exceptional 14.3% |