Syrian vs Turkish Single Father Poverty
COMPARE
Syrian
Turkish
Single Father Poverty
Single Father Poverty Comparison
Syrians
Turks
16.6%
SINGLE FATHER POVERTY
17.4/ 100
METRIC RATING
200th/ 347
METRIC RANK
15.8%
SINGLE FATHER POVERTY
95.1/ 100
METRIC RATING
109th/ 347
METRIC RANK
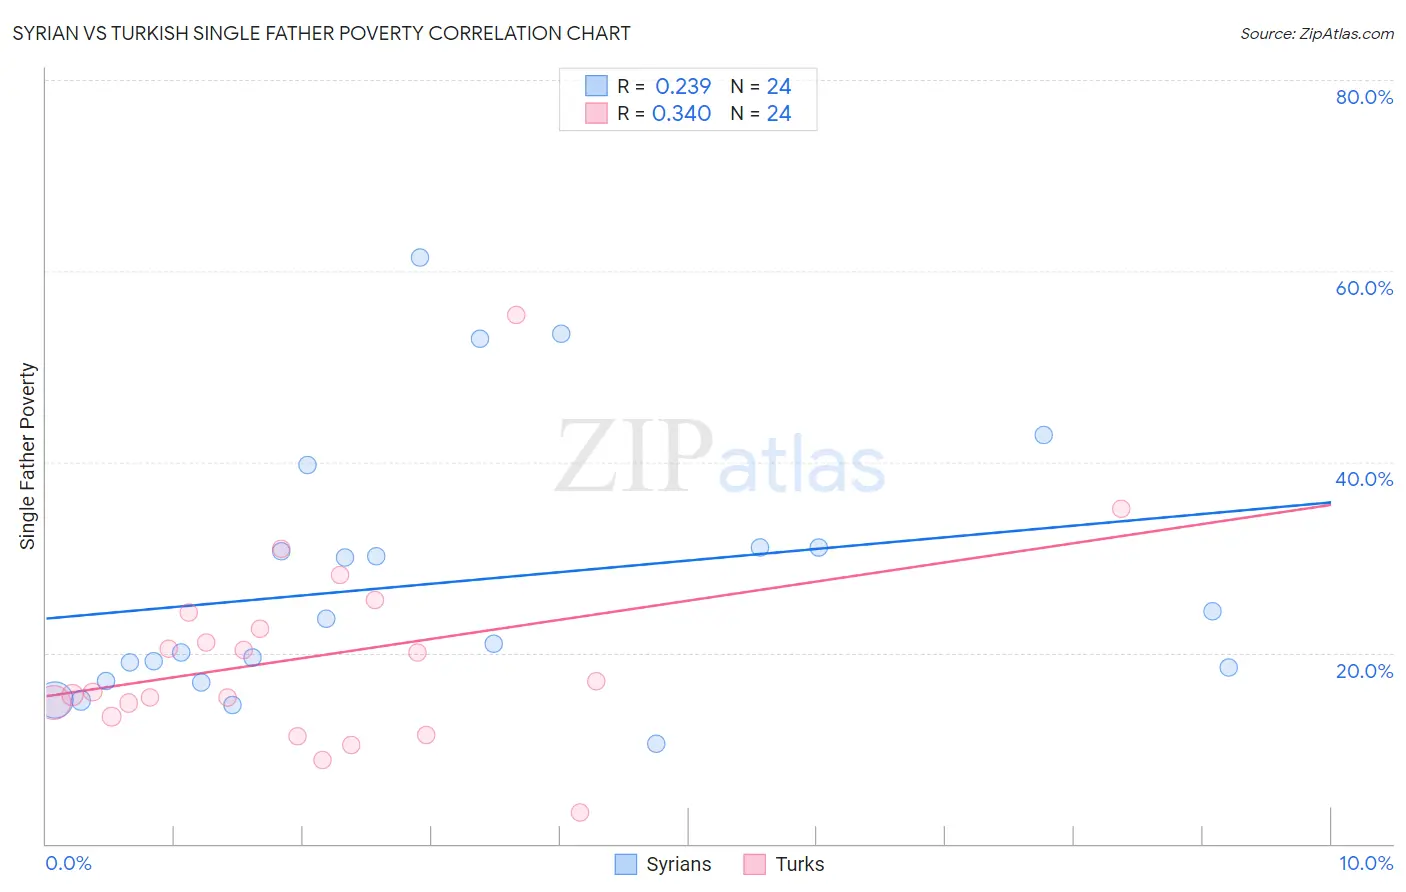
Syrian vs Turkish Single Father Poverty Correlation Chart
The statistical analysis conducted on geographies consisting of 216,304,035 people shows a weak positive correlation between the proportion of Syrians and poverty level among single fathers in the United States with a correlation coefficient (R) of 0.239 and weighted average of 16.6%. Similarly, the statistical analysis conducted on geographies consisting of 218,864,079 people shows a mild positive correlation between the proportion of Turks and poverty level among single fathers in the United States with a correlation coefficient (R) of 0.340 and weighted average of 15.8%, a difference of 5.2%.
Single Father Poverty Correlation Summary
| Measurement | Syrian | Turkish |
| Minimum | 10.4% | 3.3% |
| Maximum | 61.3% | 55.4% |
| Range | 50.9% | 52.1% |
| Mean | 27.4% | 19.6% |
| Median | 22.2% | 16.4% |
| Interquartile 25% (IQ1) | 17.7% | 14.0% |
| Interquartile 75% (IQ3) | 31.0% | 23.4% |
| Interquartile Range (IQR) | 13.3% | 9.4% |
| Standard Deviation (Sample) | 13.7% | 10.5% |
| Standard Deviation (Population) | 13.4% | 10.3% |
Similar Demographics by Single Father Poverty
Demographics Similar to Syrians by Single Father Poverty
In terms of single father poverty, the demographic groups most similar to Syrians are Cuban (16.6%, a difference of 0.070%), Immigrants from Croatia (16.6%, a difference of 0.070%), Immigrants from Belize (16.5%, a difference of 0.17%), Romanian (16.5%, a difference of 0.19%), and Immigrants from North America (16.6%, a difference of 0.19%).
| Demographics | Rating | Rank | Single Father Poverty |
| Ecuadorians | 24.5 /100 | #193 | Fair 16.5% |
| Cape Verdeans | 24.4 /100 | #194 | Fair 16.5% |
| Immigrants | Barbados | 24.3 /100 | #195 | Fair 16.5% |
| Immigrants | Canada | 21.9 /100 | #196 | Fair 16.5% |
| Immigrants | Northern Europe | 20.3 /100 | #197 | Fair 16.5% |
| Romanians | 20.1 /100 | #198 | Fair 16.5% |
| Immigrants | Belize | 19.8 /100 | #199 | Poor 16.5% |
| Syrians | 17.4 /100 | #200 | Poor 16.6% |
| Cubans | 16.5 /100 | #201 | Poor 16.6% |
| Immigrants | Croatia | 16.5 /100 | #202 | Poor 16.6% |
| Immigrants | North America | 15.1 /100 | #203 | Poor 16.6% |
| Immigrants | Guatemala | 14.8 /100 | #204 | Poor 16.6% |
| Venezuelans | 14.3 /100 | #205 | Poor 16.6% |
| Immigrants | Senegal | 13.7 /100 | #206 | Poor 16.6% |
| New Zealanders | 13.7 /100 | #207 | Poor 16.6% |
Demographics Similar to Turks by Single Father Poverty
In terms of single father poverty, the demographic groups most similar to Turks are Immigrants from Africa (15.8%, a difference of 0.010%), Bulgarian (15.8%, a difference of 0.060%), Immigrants from Latvia (15.8%, a difference of 0.090%), Danish (15.8%, a difference of 0.14%), and Argentinean (15.8%, a difference of 0.15%).
| Demographics | Rating | Rank | Single Father Poverty |
| Chileans | 96.4 /100 | #102 | Exceptional 15.7% |
| South American Indians | 96.2 /100 | #103 | Exceptional 15.7% |
| Australians | 96.1 /100 | #104 | Exceptional 15.7% |
| Immigrants | Australia | 96.1 /100 | #105 | Exceptional 15.7% |
| Immigrants | Poland | 95.8 /100 | #106 | Exceptional 15.7% |
| Native Hawaiians | 95.8 /100 | #107 | Exceptional 15.7% |
| Pakistanis | 95.7 /100 | #108 | Exceptional 15.7% |
| Turks | 95.1 /100 | #109 | Exceptional 15.8% |
| Immigrants | Africa | 95.1 /100 | #110 | Exceptional 15.8% |
| Bulgarians | 94.8 /100 | #111 | Exceptional 15.8% |
| Immigrants | Latvia | 94.7 /100 | #112 | Exceptional 15.8% |
| Danes | 94.5 /100 | #113 | Exceptional 15.8% |
| Argentineans | 94.4 /100 | #114 | Exceptional 15.8% |
| Immigrants | Thailand | 93.6 /100 | #115 | Exceptional 15.8% |
| Immigrants | Argentina | 92.8 /100 | #116 | Exceptional 15.8% |