Chippewa vs Laotian Single Father Poverty
COMPARE
Chippewa
Laotian
Single Father Poverty
Single Father Poverty Comparison
Chippewa
Laotians
18.8%
SINGLE FATHER POVERTY
0.0/ 100
METRIC RATING
310th/ 347
METRIC RANK
15.1%
SINGLE FATHER POVERTY
99.9/ 100
METRIC RATING
57th/ 347
METRIC RANK
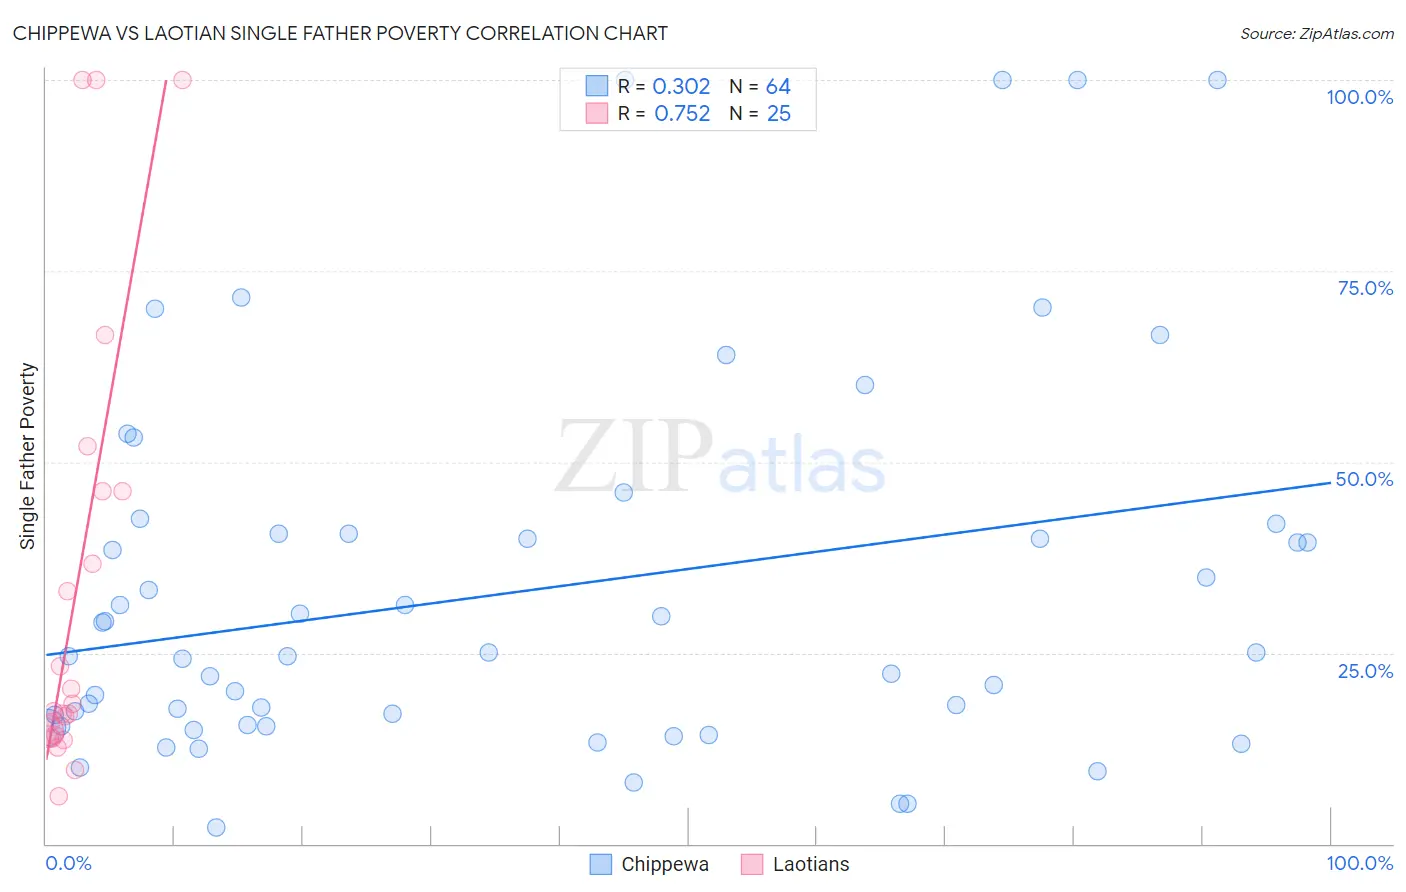
Chippewa vs Laotian Single Father Poverty Correlation Chart
The statistical analysis conducted on geographies consisting of 183,159,389 people shows a mild positive correlation between the proportion of Chippewa and poverty level among single fathers in the United States with a correlation coefficient (R) of 0.302 and weighted average of 18.8%. Similarly, the statistical analysis conducted on geographies consisting of 189,346,173 people shows a strong positive correlation between the proportion of Laotians and poverty level among single fathers in the United States with a correlation coefficient (R) of 0.752 and weighted average of 15.1%, a difference of 24.8%.
Single Father Poverty Correlation Summary
| Measurement | Chippewa | Laotian |
| Minimum | 2.1% | 6.3% |
| Maximum | 100.0% | 100.0% |
| Range | 97.9% | 93.7% |
| Mean | 33.0% | 33.0% |
| Median | 24.8% | 17.4% |
| Interquartile 25% (IQ1) | 15.5% | 14.1% |
| Interquartile 75% (IQ3) | 40.6% | 46.1% |
| Interquartile Range (IQR) | 25.1% | 32.0% |
| Standard Deviation (Sample) | 24.4% | 29.3% |
| Standard Deviation (Population) | 24.2% | 28.7% |
Similar Demographics by Single Father Poverty
Demographics Similar to Chippewa by Single Father Poverty
In terms of single father poverty, the demographic groups most similar to Chippewa are Nonimmigrants (18.8%, a difference of 0.19%), Immigrants from Dominica (18.9%, a difference of 0.24%), Potawatomi (18.9%, a difference of 0.44%), Delaware (18.9%, a difference of 0.61%), and Chickasaw (19.0%, a difference of 0.76%).
| Demographics | Rating | Rank | Single Father Poverty |
| Celtics | 0.0 /100 | #303 | Tragic 18.5% |
| Ute | 0.0 /100 | #304 | Tragic 18.5% |
| Blackfeet | 0.0 /100 | #305 | Tragic 18.5% |
| Scotch-Irish | 0.0 /100 | #306 | Tragic 18.6% |
| French Canadians | 0.0 /100 | #307 | Tragic 18.6% |
| Ottawa | 0.0 /100 | #308 | Tragic 18.6% |
| Immigrants | Micronesia | 0.0 /100 | #309 | Tragic 18.6% |
| Chippewa | 0.0 /100 | #310 | Tragic 18.8% |
| Immigrants | Nonimmigrants | 0.0 /100 | #311 | Tragic 18.8% |
| Immigrants | Dominica | 0.0 /100 | #312 | Tragic 18.9% |
| Potawatomi | 0.0 /100 | #313 | Tragic 18.9% |
| Delaware | 0.0 /100 | #314 | Tragic 18.9% |
| Chickasaw | 0.0 /100 | #315 | Tragic 19.0% |
| Osage | 0.0 /100 | #316 | Tragic 19.0% |
| Dominicans | 0.0 /100 | #317 | Tragic 19.1% |
Demographics Similar to Laotians by Single Father Poverty
In terms of single father poverty, the demographic groups most similar to Laotians are Hawaiian (15.1%, a difference of 0.060%), Immigrants from Laos (15.1%, a difference of 0.090%), Guamanian/Chamorro (15.1%, a difference of 0.15%), Immigrants from Bulgaria (15.0%, a difference of 0.36%), and Immigrants from Uzbekistan (15.0%, a difference of 0.41%).
| Demographics | Rating | Rank | Single Father Poverty |
| Bhutanese | 99.9 /100 | #50 | Exceptional 15.0% |
| Immigrants | Pakistan | 99.9 /100 | #51 | Exceptional 15.0% |
| Immigrants | El Salvador | 99.9 /100 | #52 | Exceptional 15.0% |
| Immigrants | Kenya | 99.9 /100 | #53 | Exceptional 15.0% |
| Immigrants | Uzbekistan | 99.9 /100 | #54 | Exceptional 15.0% |
| Immigrants | Bulgaria | 99.9 /100 | #55 | Exceptional 15.0% |
| Immigrants | Laos | 99.9 /100 | #56 | Exceptional 15.1% |
| Laotians | 99.9 /100 | #57 | Exceptional 15.1% |
| Hawaiians | 99.9 /100 | #58 | Exceptional 15.1% |
| Guamanians/Chamorros | 99.9 /100 | #59 | Exceptional 15.1% |
| Puget Sound Salish | 99.8 /100 | #60 | Exceptional 15.2% |
| Immigrants | Bosnia and Herzegovina | 99.8 /100 | #61 | Exceptional 15.2% |
| Immigrants | Armenia | 99.8 /100 | #62 | Exceptional 15.2% |
| Immigrants | Sweden | 99.8 /100 | #63 | Exceptional 15.2% |
| Bangladeshis | 99.8 /100 | #64 | Exceptional 15.2% |