Serbian vs Turkish Single Father Poverty
COMPARE
Serbian
Turkish
Single Father Poverty
Single Father Poverty Comparison
Serbians
Turks
16.4%
SINGLE FATHER POVERTY
40.9/ 100
METRIC RATING
179th/ 347
METRIC RANK
15.8%
SINGLE FATHER POVERTY
95.1/ 100
METRIC RATING
109th/ 347
METRIC RANK
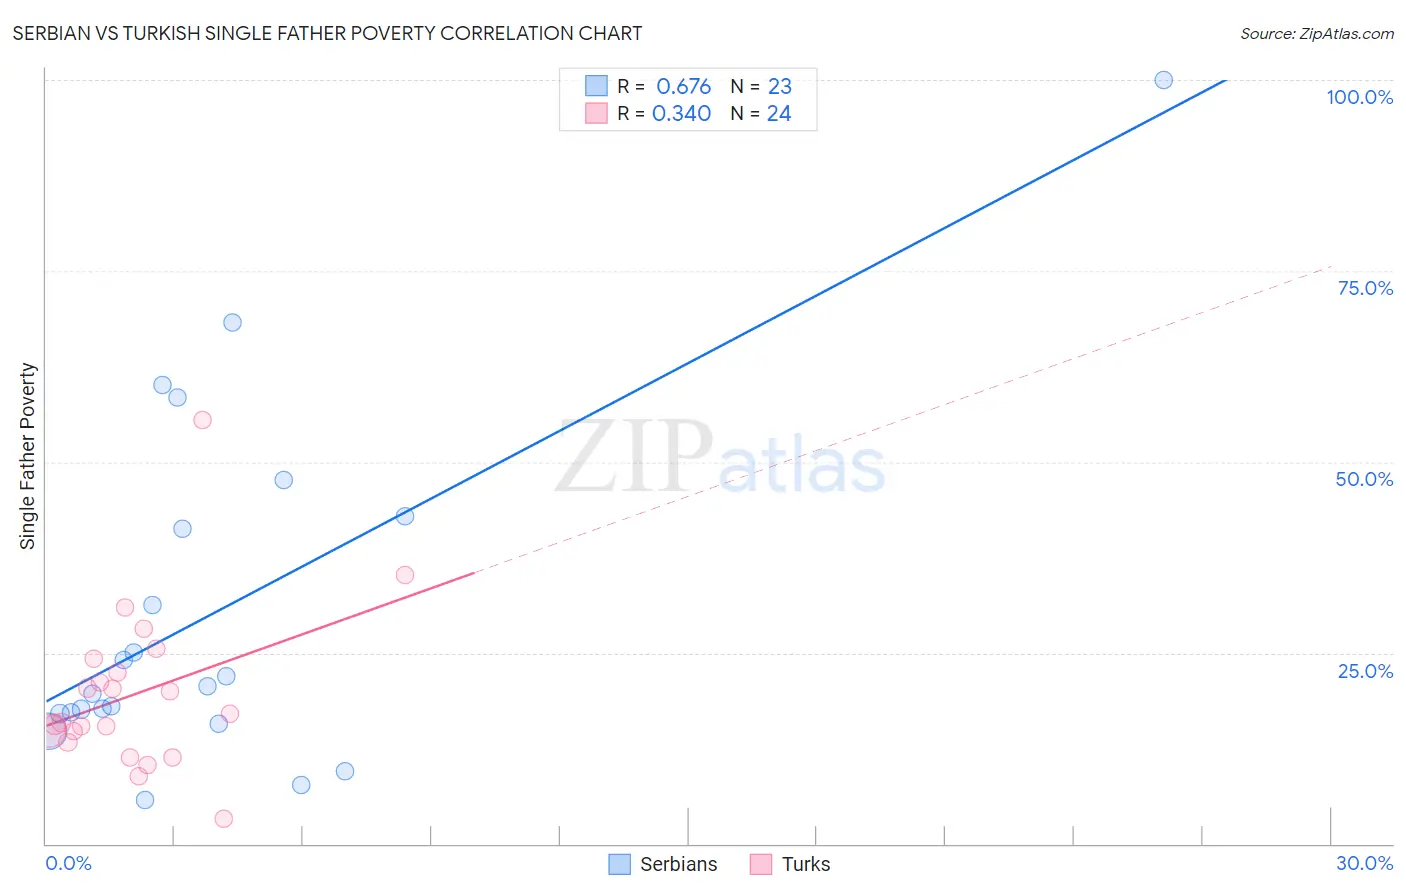
Serbian vs Turkish Single Father Poverty Correlation Chart
The statistical analysis conducted on geographies consisting of 216,450,025 people shows a significant positive correlation between the proportion of Serbians and poverty level among single fathers in the United States with a correlation coefficient (R) of 0.676 and weighted average of 16.4%. Similarly, the statistical analysis conducted on geographies consisting of 218,864,079 people shows a mild positive correlation between the proportion of Turks and poverty level among single fathers in the United States with a correlation coefficient (R) of 0.340 and weighted average of 15.8%, a difference of 3.8%.
Single Father Poverty Correlation Summary
| Measurement | Serbian | Turkish |
| Minimum | 5.7% | 3.3% |
| Maximum | 100.0% | 55.4% |
| Range | 94.3% | 52.1% |
| Mean | 30.5% | 19.6% |
| Median | 20.7% | 16.4% |
| Interquartile 25% (IQ1) | 17.0% | 14.0% |
| Interquartile 75% (IQ3) | 42.9% | 23.4% |
| Interquartile Range (IQR) | 25.8% | 9.4% |
| Standard Deviation (Sample) | 23.1% | 10.5% |
| Standard Deviation (Population) | 22.6% | 10.3% |
Similar Demographics by Single Father Poverty
Demographics Similar to Serbians by Single Father Poverty
In terms of single father poverty, the demographic groups most similar to Serbians are Immigrants from Cuba (16.4%, a difference of 0.030%), Immigrants from South Africa (16.3%, a difference of 0.15%), Immigrants from Latin America (16.4%, a difference of 0.17%), Immigrants from Western Africa (16.4%, a difference of 0.23%), and Immigrants from Italy (16.4%, a difference of 0.24%).
| Demographics | Rating | Rank | Single Father Poverty |
| Immigrants | Sierra Leone | 50.1 /100 | #172 | Average 16.3% |
| Immigrants | St. Vincent and the Grenadines | 50.0 /100 | #173 | Average 16.3% |
| Swedes | 50.0 /100 | #174 | Average 16.3% |
| Immigrants | Ecuador | 49.7 /100 | #175 | Average 16.3% |
| Vietnamese | 48.0 /100 | #176 | Average 16.3% |
| Immigrants | South Africa | 44.2 /100 | #177 | Average 16.3% |
| Immigrants | Cuba | 41.6 /100 | #178 | Average 16.4% |
| Serbians | 40.9 /100 | #179 | Average 16.4% |
| Immigrants | Latin America | 37.2 /100 | #180 | Fair 16.4% |
| Immigrants | Western Africa | 36.0 /100 | #181 | Fair 16.4% |
| Immigrants | Italy | 35.7 /100 | #182 | Fair 16.4% |
| Aleuts | 35.3 /100 | #183 | Fair 16.4% |
| Cambodians | 34.6 /100 | #184 | Fair 16.4% |
| Panamanians | 33.6 /100 | #185 | Fair 16.4% |
| Immigrants | Venezuela | 31.0 /100 | #186 | Fair 16.4% |
Demographics Similar to Turks by Single Father Poverty
In terms of single father poverty, the demographic groups most similar to Turks are Immigrants from Africa (15.8%, a difference of 0.010%), Bulgarian (15.8%, a difference of 0.060%), Immigrants from Latvia (15.8%, a difference of 0.090%), Danish (15.8%, a difference of 0.14%), and Argentinean (15.8%, a difference of 0.15%).
| Demographics | Rating | Rank | Single Father Poverty |
| Chileans | 96.4 /100 | #102 | Exceptional 15.7% |
| South American Indians | 96.2 /100 | #103 | Exceptional 15.7% |
| Australians | 96.1 /100 | #104 | Exceptional 15.7% |
| Immigrants | Australia | 96.1 /100 | #105 | Exceptional 15.7% |
| Immigrants | Poland | 95.8 /100 | #106 | Exceptional 15.7% |
| Native Hawaiians | 95.8 /100 | #107 | Exceptional 15.7% |
| Pakistanis | 95.7 /100 | #108 | Exceptional 15.7% |
| Turks | 95.1 /100 | #109 | Exceptional 15.8% |
| Immigrants | Africa | 95.1 /100 | #110 | Exceptional 15.8% |
| Bulgarians | 94.8 /100 | #111 | Exceptional 15.8% |
| Immigrants | Latvia | 94.7 /100 | #112 | Exceptional 15.8% |
| Danes | 94.5 /100 | #113 | Exceptional 15.8% |
| Argentineans | 94.4 /100 | #114 | Exceptional 15.8% |
| Immigrants | Thailand | 93.6 /100 | #115 | Exceptional 15.8% |
| Immigrants | Argentina | 92.8 /100 | #116 | Exceptional 15.8% |