Burmese vs Turkish Single Father Poverty
COMPARE
Burmese
Turkish
Single Father Poverty
Single Father Poverty Comparison
Burmese
Turks
15.5%
SINGLE FATHER POVERTY
99.0/ 100
METRIC RATING
88th/ 347
METRIC RANK
15.8%
SINGLE FATHER POVERTY
95.1/ 100
METRIC RATING
109th/ 347
METRIC RANK
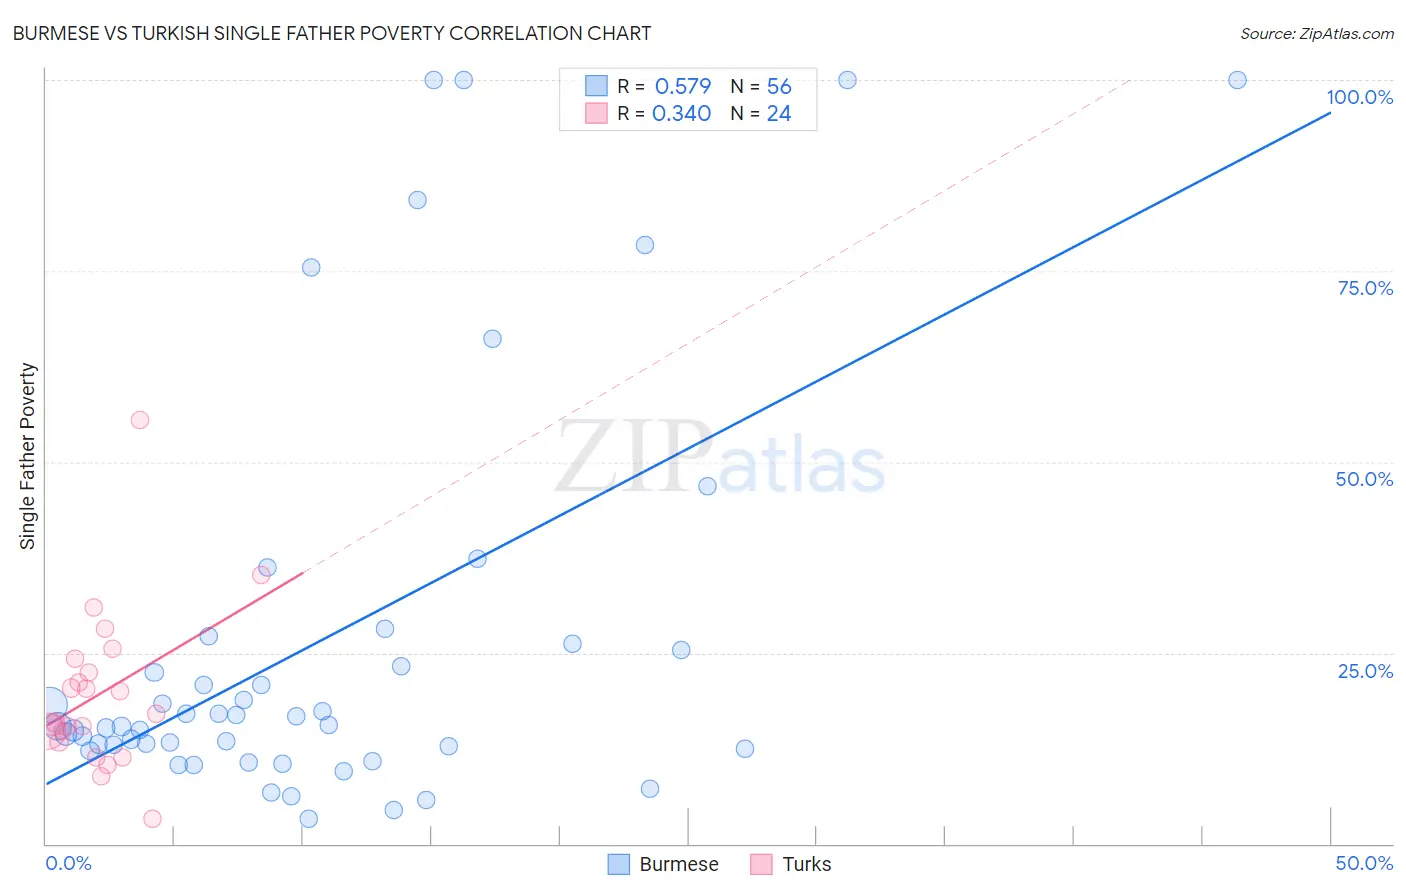
Burmese vs Turkish Single Father Poverty Correlation Chart
The statistical analysis conducted on geographies consisting of 355,001,827 people shows a substantial positive correlation between the proportion of Burmese and poverty level among single fathers in the United States with a correlation coefficient (R) of 0.579 and weighted average of 15.5%. Similarly, the statistical analysis conducted on geographies consisting of 218,864,079 people shows a mild positive correlation between the proportion of Turks and poverty level among single fathers in the United States with a correlation coefficient (R) of 0.340 and weighted average of 15.8%, a difference of 1.9%.
Single Father Poverty Correlation Summary
| Measurement | Burmese | Turkish |
| Minimum | 3.2% | 3.3% |
| Maximum | 100.0% | 55.4% |
| Range | 96.8% | 52.1% |
| Mean | 26.6% | 19.6% |
| Median | 15.4% | 16.4% |
| Interquartile 25% (IQ1) | 12.7% | 14.0% |
| Interquartile 75% (IQ3) | 25.9% | 23.4% |
| Interquartile Range (IQR) | 13.2% | 9.4% |
| Standard Deviation (Sample) | 26.9% | 10.5% |
| Standard Deviation (Population) | 26.7% | 10.3% |
Similar Demographics by Single Father Poverty
Demographics Similar to Burmese by Single Father Poverty
In terms of single father poverty, the demographic groups most similar to Burmese are Brazilian (15.5%, a difference of 0.030%), Immigrants from Russia (15.5%, a difference of 0.040%), Immigrants from Korea (15.5%, a difference of 0.060%), Immigrants from Oceania (15.4%, a difference of 0.16%), and Peruvian (15.4%, a difference of 0.28%).
| Demographics | Rating | Rank | Single Father Poverty |
| Immigrants | Congo | 99.4 /100 | #81 | Exceptional 15.4% |
| Immigrants | Ukraine | 99.4 /100 | #82 | Exceptional 15.4% |
| Chinese | 99.3 /100 | #83 | Exceptional 15.4% |
| Peruvians | 99.2 /100 | #84 | Exceptional 15.4% |
| Immigrants | Oceania | 99.1 /100 | #85 | Exceptional 15.4% |
| Immigrants | Russia | 99.0 /100 | #86 | Exceptional 15.5% |
| Brazilians | 99.0 /100 | #87 | Exceptional 15.5% |
| Burmese | 99.0 /100 | #88 | Exceptional 15.5% |
| Immigrants | Korea | 99.0 /100 | #89 | Exceptional 15.5% |
| Mexican American Indians | 98.7 /100 | #90 | Exceptional 15.5% |
| Immigrants | Romania | 98.6 /100 | #91 | Exceptional 15.5% |
| Immigrants | Serbia | 98.5 /100 | #92 | Exceptional 15.5% |
| Basques | 98.4 /100 | #93 | Exceptional 15.5% |
| Immigrants | Uruguay | 98.2 /100 | #94 | Exceptional 15.6% |
| Immigrants | Kazakhstan | 98.2 /100 | #95 | Exceptional 15.6% |
Demographics Similar to Turks by Single Father Poverty
In terms of single father poverty, the demographic groups most similar to Turks are Immigrants from Africa (15.8%, a difference of 0.010%), Bulgarian (15.8%, a difference of 0.060%), Immigrants from Latvia (15.8%, a difference of 0.090%), Danish (15.8%, a difference of 0.14%), and Argentinean (15.8%, a difference of 0.15%).
| Demographics | Rating | Rank | Single Father Poverty |
| Chileans | 96.4 /100 | #102 | Exceptional 15.7% |
| South American Indians | 96.2 /100 | #103 | Exceptional 15.7% |
| Australians | 96.1 /100 | #104 | Exceptional 15.7% |
| Immigrants | Australia | 96.1 /100 | #105 | Exceptional 15.7% |
| Immigrants | Poland | 95.8 /100 | #106 | Exceptional 15.7% |
| Native Hawaiians | 95.8 /100 | #107 | Exceptional 15.7% |
| Pakistanis | 95.7 /100 | #108 | Exceptional 15.7% |
| Turks | 95.1 /100 | #109 | Exceptional 15.8% |
| Immigrants | Africa | 95.1 /100 | #110 | Exceptional 15.8% |
| Bulgarians | 94.8 /100 | #111 | Exceptional 15.8% |
| Immigrants | Latvia | 94.7 /100 | #112 | Exceptional 15.8% |
| Danes | 94.5 /100 | #113 | Exceptional 15.8% |
| Argentineans | 94.4 /100 | #114 | Exceptional 15.8% |
| Immigrants | Thailand | 93.6 /100 | #115 | Exceptional 15.8% |
| Immigrants | Argentina | 92.8 /100 | #116 | Exceptional 15.8% |