Chilean vs Potawatomi Divorced or Separated
COMPARE
Chilean
Potawatomi
Divorced or Separated
Divorced or Separated Comparison
Chileans
Potawatomi
12.0%
DIVORCED OR SEPARATED
71.3/ 100
METRIC RATING
154th/ 347
METRIC RANK
13.5%
DIVORCED OR SEPARATED
0.0/ 100
METRIC RATING
325th/ 347
METRIC RANK
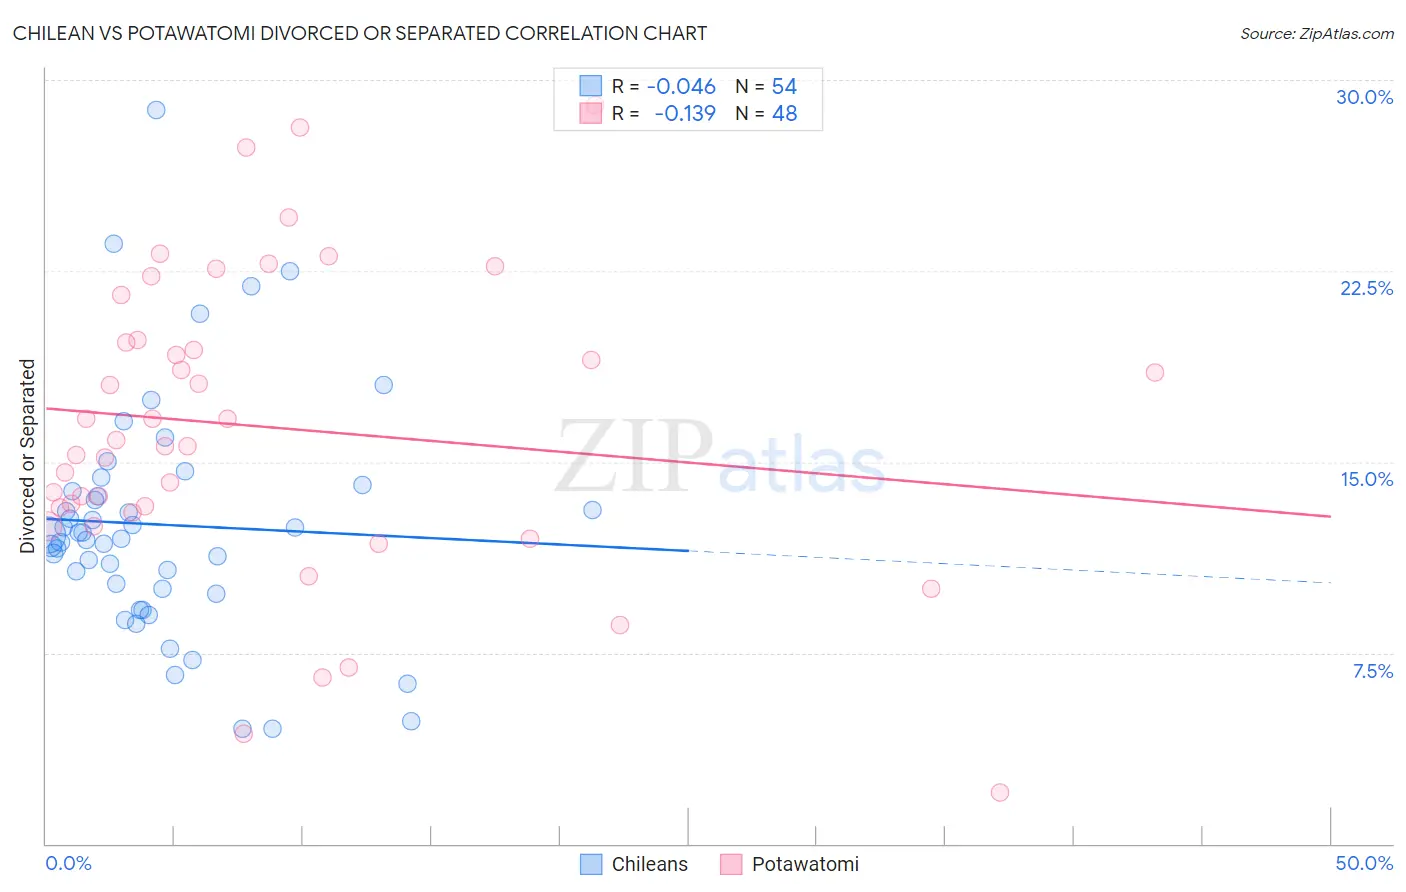
Chilean vs Potawatomi Divorced or Separated Correlation Chart
The statistical analysis conducted on geographies consisting of 256,589,464 people shows no correlation between the proportion of Chileans and percentage of population currently divorced or separated in the United States with a correlation coefficient (R) of -0.046 and weighted average of 12.0%. Similarly, the statistical analysis conducted on geographies consisting of 117,768,294 people shows a poor negative correlation between the proportion of Potawatomi and percentage of population currently divorced or separated in the United States with a correlation coefficient (R) of -0.139 and weighted average of 13.5%, a difference of 12.5%.
Divorced or Separated Correlation Summary
| Measurement | Chilean | Potawatomi |
| Minimum | 4.5% | 2.0% |
| Maximum | 28.8% | 29.0% |
| Range | 24.3% | 27.0% |
| Mean | 12.5% | 16.4% |
| Median | 12.0% | 15.7% |
| Interquartile 25% (IQ1) | 10.0% | 13.1% |
| Interquartile 75% (IQ3) | 13.9% | 19.7% |
| Interquartile Range (IQR) | 3.9% | 6.6% |
| Standard Deviation (Sample) | 4.7% | 5.9% |
| Standard Deviation (Population) | 4.6% | 5.8% |
Similar Demographics by Divorced or Separated
Demographics Similar to Chileans by Divorced or Separated
In terms of divorced or separated, the demographic groups most similar to Chileans are Japanese (12.0%, a difference of 0.020%), Austrian (12.0%, a difference of 0.040%), Hungarian (12.0%, a difference of 0.040%), Immigrants from Hungary (11.9%, a difference of 0.10%), and Immigrants from Brazil (12.0%, a difference of 0.10%).
| Demographics | Rating | Rank | Divorced or Separated |
| Poles | 78.6 /100 | #147 | Good 11.9% |
| Italians | 77.8 /100 | #148 | Good 11.9% |
| Immigrants | Oceania | 77.7 /100 | #149 | Good 11.9% |
| Immigrants | Portugal | 77.3 /100 | #150 | Good 11.9% |
| Czechs | 76.4 /100 | #151 | Good 11.9% |
| Immigrants | Hungary | 73.7 /100 | #152 | Good 11.9% |
| Austrians | 72.2 /100 | #153 | Good 12.0% |
| Chileans | 71.3 /100 | #154 | Good 12.0% |
| Japanese | 70.9 /100 | #155 | Good 12.0% |
| Hungarians | 70.3 /100 | #156 | Good 12.0% |
| Immigrants | Brazil | 68.8 /100 | #157 | Good 12.0% |
| Icelanders | 66.0 /100 | #158 | Good 12.0% |
| Immigrants | Barbados | 66.0 /100 | #159 | Good 12.0% |
| Immigrants | Scotland | 65.8 /100 | #160 | Good 12.0% |
| Marshallese | 64.6 /100 | #161 | Good 12.0% |
Demographics Similar to Potawatomi by Divorced or Separated
In terms of divorced or separated, the demographic groups most similar to Potawatomi are Immigrants from Congo (13.5%, a difference of 0.010%), Osage (13.4%, a difference of 0.060%), U.S. Virgin Islander (13.4%, a difference of 0.13%), Immigrants from Haiti (13.4%, a difference of 0.35%), and Comanche (13.5%, a difference of 0.49%).
| Demographics | Rating | Rank | Divorced or Separated |
| Cree | 0.0 /100 | #318 | Tragic 13.4% |
| Puget Sound Salish | 0.0 /100 | #319 | Tragic 13.4% |
| Cajuns | 0.0 /100 | #320 | Tragic 13.4% |
| Cheyenne | 0.0 /100 | #321 | Tragic 13.4% |
| Immigrants | Haiti | 0.0 /100 | #322 | Tragic 13.4% |
| U.S. Virgin Islanders | 0.0 /100 | #323 | Tragic 13.4% |
| Osage | 0.0 /100 | #324 | Tragic 13.4% |
| Potawatomi | 0.0 /100 | #325 | Tragic 13.5% |
| Immigrants | Congo | 0.0 /100 | #326 | Tragic 13.5% |
| Comanche | 0.0 /100 | #327 | Tragic 13.5% |
| Immigrants | Caribbean | 0.0 /100 | #328 | Tragic 13.6% |
| Houma | 0.0 /100 | #329 | Tragic 13.6% |
| Paiute | 0.0 /100 | #330 | Tragic 13.6% |
| Blacks/African Americans | 0.0 /100 | #331 | Tragic 13.6% |
| Cherokee | 0.0 /100 | #332 | Tragic 13.7% |