British vs Immigrants from Italy Child Poverty Among Girls Under 16
COMPARE
British
Immigrants from Italy
Child Poverty Among Girls Under 16
Child Poverty Among Girls Under 16 Comparison
British
Immigrants from Italy
15.0%
CHILD POVERTY AMONG GIRLS UNDER 16
95.6/ 100
METRIC RATING
103rd/ 347
METRIC RANK
14.8%
CHILD POVERTY AMONG GIRLS UNDER 16
97.4/ 100
METRIC RATING
83rd/ 347
METRIC RANK
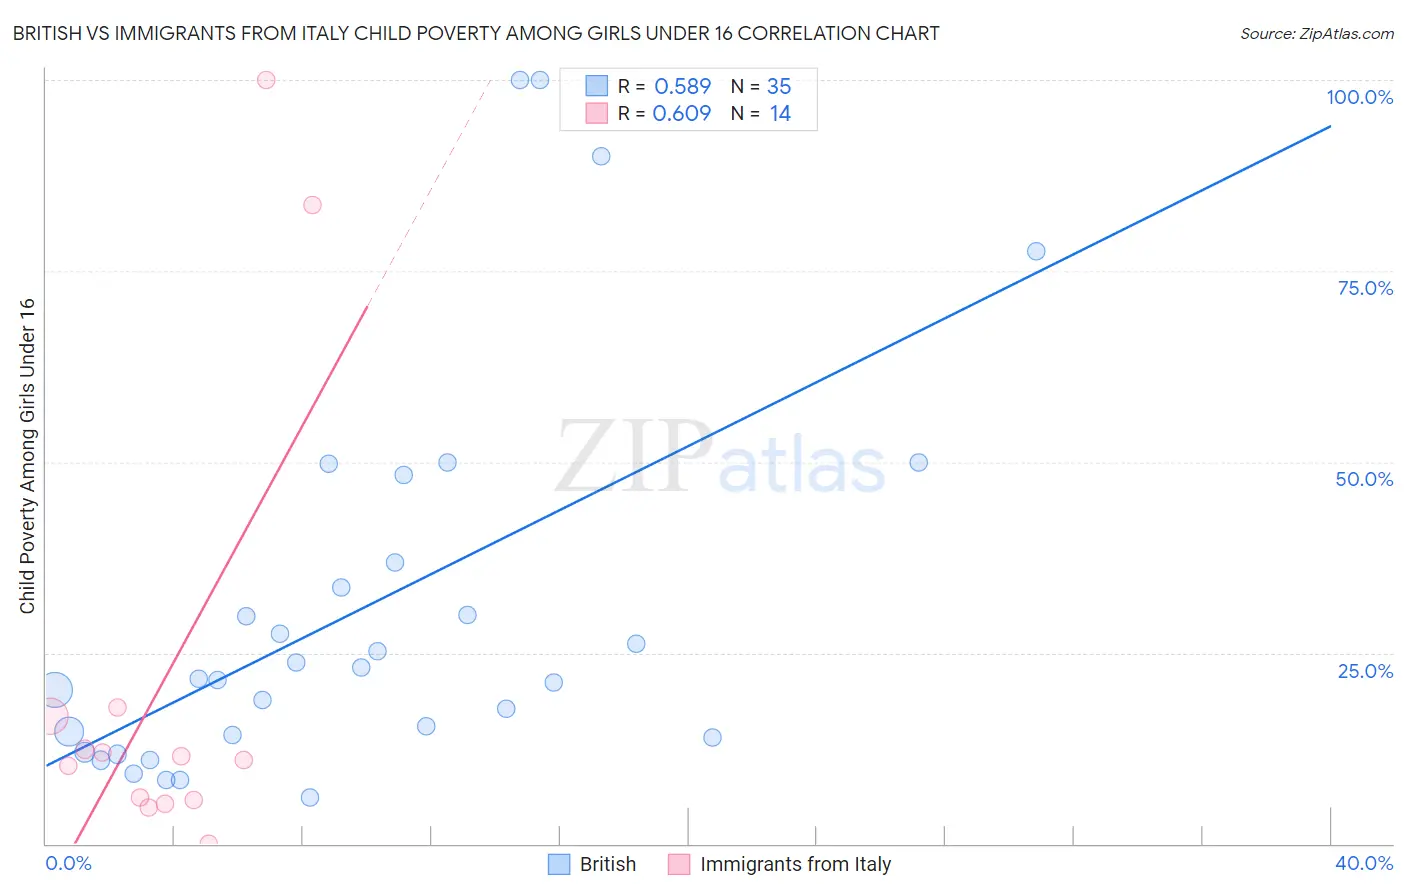
British vs Immigrants from Italy Child Poverty Among Girls Under 16 Correlation Chart
The statistical analysis conducted on geographies consisting of 514,706,514 people shows a substantial positive correlation between the proportion of British and poverty level among girls under the age of 16 in the United States with a correlation coefficient (R) of 0.589 and weighted average of 15.0%. Similarly, the statistical analysis conducted on geographies consisting of 317,038,083 people shows a significant positive correlation between the proportion of Immigrants from Italy and poverty level among girls under the age of 16 in the United States with a correlation coefficient (R) of 0.609 and weighted average of 14.8%, a difference of 1.7%.
Child Poverty Among Girls Under 16 Correlation Summary
| Measurement | British | Immigrants from Italy |
| Minimum | 6.1% | 0.033% |
| Maximum | 100.0% | 100.0% |
| Range | 93.9% | 100.0% |
| Mean | 30.8% | 21.2% |
| Median | 21.5% | 11.2% |
| Interquartile 25% (IQ1) | 14.0% | 5.7% |
| Interquartile 75% (IQ3) | 36.8% | 16.7% |
| Interquartile Range (IQR) | 22.8% | 11.0% |
| Standard Deviation (Sample) | 25.6% | 30.5% |
| Standard Deviation (Population) | 25.2% | 29.3% |
Demographics Similar to British and Immigrants from Italy by Child Poverty Among Girls Under 16
In terms of child poverty among girls under 16, the demographic groups most similar to British are Immigrants from Malaysia (15.0%, a difference of 0.020%), Immigrants from South Africa (15.0%, a difference of 0.030%), Paraguayan (15.0%, a difference of 0.070%), Immigrants from Egypt (15.0%, a difference of 0.11%), and Basque (15.0%, a difference of 0.26%). Similarly, the demographic groups most similar to Immigrants from Italy are Soviet Union (14.8%, a difference of 0.070%), Swiss (14.8%, a difference of 0.19%), Australian (14.8%, a difference of 0.23%), Finnish (14.8%, a difference of 0.25%), and Immigrants from Canada (14.8%, a difference of 0.32%).
| Demographics | Rating | Rank | Child Poverty Among Girls Under 16 |
| Immigrants | Italy | 97.4 /100 | #83 | Exceptional 14.8% |
| Soviet Union | 97.3 /100 | #84 | Exceptional 14.8% |
| Swiss | 97.2 /100 | #85 | Exceptional 14.8% |
| Australians | 97.2 /100 | #86 | Exceptional 14.8% |
| Finns | 97.2 /100 | #87 | Exceptional 14.8% |
| Immigrants | Canada | 97.1 /100 | #88 | Exceptional 14.8% |
| Jordanians | 97.1 /100 | #89 | Exceptional 14.8% |
| Northern Europeans | 97.0 /100 | #90 | Exceptional 14.8% |
| Immigrants | Belarus | 97.0 /100 | #91 | Exceptional 14.8% |
| Austrians | 96.7 /100 | #92 | Exceptional 14.9% |
| Immigrants | North America | 96.6 /100 | #93 | Exceptional 14.9% |
| Immigrants | Switzerland | 96.3 /100 | #94 | Exceptional 14.9% |
| Germans | 96.3 /100 | #95 | Exceptional 14.9% |
| Immigrants | France | 96.2 /100 | #96 | Exceptional 14.9% |
| Immigrants | Latvia | 96.1 /100 | #97 | Exceptional 14.9% |
| Basques | 95.9 /100 | #98 | Exceptional 15.0% |
| Immigrants | Egypt | 95.7 /100 | #99 | Exceptional 15.0% |
| Paraguayans | 95.7 /100 | #100 | Exceptional 15.0% |
| Immigrants | South Africa | 95.6 /100 | #101 | Exceptional 15.0% |
| Immigrants | Malaysia | 95.6 /100 | #102 | Exceptional 15.0% |
| British | 95.6 /100 | #103 | Exceptional 15.0% |