Cherokee vs Northern European Male Poverty
COMPARE
Cherokee
Northern European
Male Poverty
Male Poverty Comparison
Cherokee
Northern Europeans
13.1%
MALE POVERTY
0.1/ 100
METRIC RATING
259th/ 347
METRIC RANK
10.4%
MALE POVERTY
95.2/ 100
METRIC RATING
87th/ 347
METRIC RANK
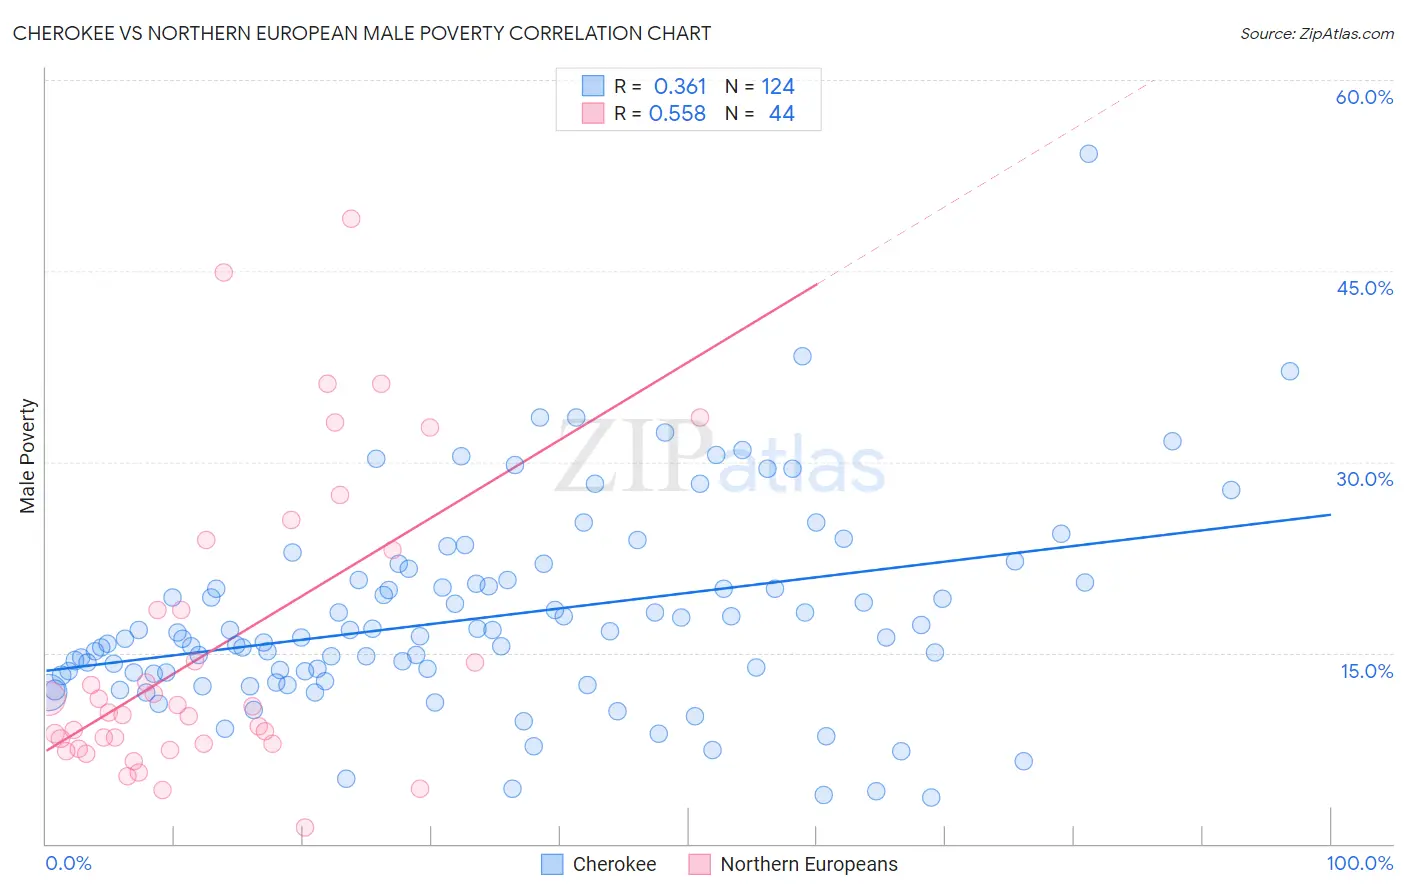
Cherokee vs Northern European Male Poverty Correlation Chart
The statistical analysis conducted on geographies consisting of 493,122,545 people shows a mild positive correlation between the proportion of Cherokee and poverty level among males in the United States with a correlation coefficient (R) of 0.361 and weighted average of 13.1%. Similarly, the statistical analysis conducted on geographies consisting of 405,718,489 people shows a substantial positive correlation between the proportion of Northern Europeans and poverty level among males in the United States with a correlation coefficient (R) of 0.558 and weighted average of 10.4%, a difference of 26.3%.
Male Poverty Correlation Summary
| Measurement | Cherokee | Northern European |
| Minimum | 3.6% | 1.2% |
| Maximum | 54.2% | 49.1% |
| Range | 50.6% | 47.9% |
| Mean | 17.8% | 15.3% |
| Median | 16.3% | 10.6% |
| Interquartile 25% (IQ1) | 13.4% | 7.9% |
| Interquartile 75% (IQ3) | 20.6% | 20.7% |
| Interquartile Range (IQR) | 7.2% | 12.9% |
| Standard Deviation (Sample) | 7.8% | 11.6% |
| Standard Deviation (Population) | 7.8% | 11.5% |
Similar Demographics by Male Poverty
Demographics Similar to Cherokee by Male Poverty
In terms of male poverty, the demographic groups most similar to Cherokee are Ottawa (13.1%, a difference of 0.11%), Trinidadian and Tobagonian (13.1%, a difference of 0.13%), Cape Verdean (13.1%, a difference of 0.16%), Spanish American Indian (13.1%, a difference of 0.18%), and Immigrants from Trinidad and Tobago (13.1%, a difference of 0.29%).
| Demographics | Rating | Rank | Male Poverty |
| Immigrants | Ecuador | 0.2 /100 | #252 | Tragic 12.9% |
| Immigrants | Ghana | 0.2 /100 | #253 | Tragic 12.9% |
| Mexican American Indians | 0.1 /100 | #254 | Tragic 13.0% |
| Immigrants | Liberia | 0.1 /100 | #255 | Tragic 13.0% |
| Immigrants | Burma/Myanmar | 0.1 /100 | #256 | Tragic 13.0% |
| Immigrants | Trinidad and Tobago | 0.1 /100 | #257 | Tragic 13.1% |
| Cape Verdeans | 0.1 /100 | #258 | Tragic 13.1% |
| Cherokee | 0.1 /100 | #259 | Tragic 13.1% |
| Ottawa | 0.1 /100 | #260 | Tragic 13.1% |
| Trinidadians and Tobagonians | 0.1 /100 | #261 | Tragic 13.1% |
| Spanish American Indians | 0.1 /100 | #262 | Tragic 13.1% |
| Central Americans | 0.1 /100 | #263 | Tragic 13.2% |
| Iroquois | 0.1 /100 | #264 | Tragic 13.2% |
| Jamaicans | 0.1 /100 | #265 | Tragic 13.2% |
| Immigrants | Guyana | 0.1 /100 | #266 | Tragic 13.2% |
Demographics Similar to Northern Europeans by Male Poverty
In terms of male poverty, the demographic groups most similar to Northern Europeans are Immigrants from Eastern Asia (10.4%, a difference of 0.040%), Cambodian (10.4%, a difference of 0.14%), Immigrants from Denmark (10.4%, a difference of 0.14%), Immigrants from England (10.4%, a difference of 0.17%), and Indian (Asian) (10.4%, a difference of 0.17%).
| Demographics | Rating | Rank | Male Poverty |
| English | 96.4 /100 | #80 | Exceptional 10.3% |
| Belgians | 95.9 /100 | #81 | Exceptional 10.3% |
| Egyptians | 95.9 /100 | #82 | Exceptional 10.3% |
| Immigrants | Sweden | 95.7 /100 | #83 | Exceptional 10.3% |
| Czechoslovakians | 95.6 /100 | #84 | Exceptional 10.3% |
| Immigrants | England | 95.5 /100 | #85 | Exceptional 10.4% |
| Immigrants | Eastern Asia | 95.3 /100 | #86 | Exceptional 10.4% |
| Northern Europeans | 95.2 /100 | #87 | Exceptional 10.4% |
| Cambodians | 95.0 /100 | #88 | Exceptional 10.4% |
| Immigrants | Denmark | 95.0 /100 | #89 | Exceptional 10.4% |
| Indians (Asian) | 94.9 /100 | #90 | Exceptional 10.4% |
| British | 94.8 /100 | #91 | Exceptional 10.4% |
| Jordanians | 94.4 /100 | #92 | Exceptional 10.4% |
| Australians | 94.4 /100 | #93 | Exceptional 10.4% |
| Immigrants | South Africa | 94.1 /100 | #94 | Exceptional 10.4% |