Cherokee vs Immigrants from Honduras Male Poverty
COMPARE
Cherokee
Immigrants from Honduras
Male Poverty
Male Poverty Comparison
Cherokee
Immigrants from Honduras
13.1%
MALE POVERTY
0.1/ 100
METRIC RATING
259th/ 347
METRIC RANK
14.6%
MALE POVERTY
0.0/ 100
METRIC RATING
314th/ 347
METRIC RANK
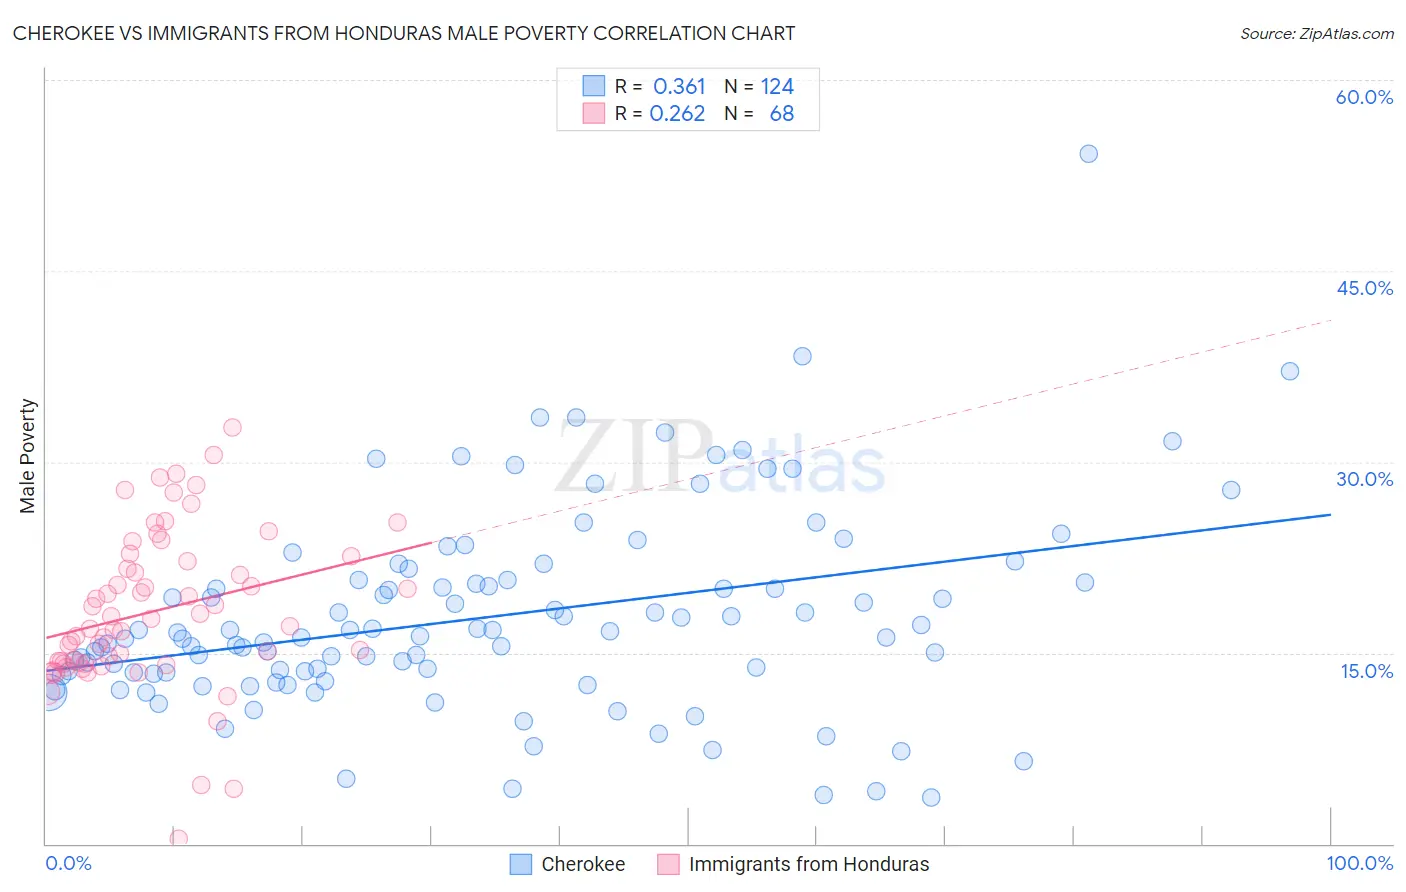
Cherokee vs Immigrants from Honduras Male Poverty Correlation Chart
The statistical analysis conducted on geographies consisting of 493,122,545 people shows a mild positive correlation between the proportion of Cherokee and poverty level among males in the United States with a correlation coefficient (R) of 0.361 and weighted average of 13.1%. Similarly, the statistical analysis conducted on geographies consisting of 322,443,990 people shows a weak positive correlation between the proportion of Immigrants from Honduras and poverty level among males in the United States with a correlation coefficient (R) of 0.262 and weighted average of 14.6%, a difference of 11.4%.
Male Poverty Correlation Summary
| Measurement | Cherokee | Immigrants from Honduras |
| Minimum | 3.6% | 0.43% |
| Maximum | 54.2% | 32.7% |
| Range | 50.6% | 32.3% |
| Mean | 17.8% | 18.3% |
| Median | 16.3% | 17.4% |
| Interquartile 25% (IQ1) | 13.4% | 14.2% |
| Interquartile 75% (IQ3) | 20.6% | 22.3% |
| Interquartile Range (IQR) | 7.2% | 8.1% |
| Standard Deviation (Sample) | 7.8% | 6.2% |
| Standard Deviation (Population) | 7.8% | 6.1% |
Similar Demographics by Male Poverty
Demographics Similar to Cherokee by Male Poverty
In terms of male poverty, the demographic groups most similar to Cherokee are Ottawa (13.1%, a difference of 0.11%), Trinidadian and Tobagonian (13.1%, a difference of 0.13%), Cape Verdean (13.1%, a difference of 0.16%), Spanish American Indian (13.1%, a difference of 0.18%), and Immigrants from Trinidad and Tobago (13.1%, a difference of 0.29%).
| Demographics | Rating | Rank | Male Poverty |
| Immigrants | Ecuador | 0.2 /100 | #252 | Tragic 12.9% |
| Immigrants | Ghana | 0.2 /100 | #253 | Tragic 12.9% |
| Mexican American Indians | 0.1 /100 | #254 | Tragic 13.0% |
| Immigrants | Liberia | 0.1 /100 | #255 | Tragic 13.0% |
| Immigrants | Burma/Myanmar | 0.1 /100 | #256 | Tragic 13.0% |
| Immigrants | Trinidad and Tobago | 0.1 /100 | #257 | Tragic 13.1% |
| Cape Verdeans | 0.1 /100 | #258 | Tragic 13.1% |
| Cherokee | 0.1 /100 | #259 | Tragic 13.1% |
| Ottawa | 0.1 /100 | #260 | Tragic 13.1% |
| Trinidadians and Tobagonians | 0.1 /100 | #261 | Tragic 13.1% |
| Spanish American Indians | 0.1 /100 | #262 | Tragic 13.1% |
| Central Americans | 0.1 /100 | #263 | Tragic 13.2% |
| Iroquois | 0.1 /100 | #264 | Tragic 13.2% |
| Jamaicans | 0.1 /100 | #265 | Tragic 13.2% |
| Immigrants | Guyana | 0.1 /100 | #266 | Tragic 13.2% |
Demographics Similar to Immigrants from Honduras by Male Poverty
In terms of male poverty, the demographic groups most similar to Immigrants from Honduras are Immigrants from Somalia (14.6%, a difference of 0.040%), Chippewa (14.6%, a difference of 0.080%), British West Indian (14.6%, a difference of 0.10%), Immigrants from Dominica (14.7%, a difference of 0.78%), and Immigrants from Grenada (14.7%, a difference of 0.84%).
| Demographics | Rating | Rank | Male Poverty |
| Dutch West Indians | 0.0 /100 | #307 | Tragic 14.2% |
| Africans | 0.0 /100 | #308 | Tragic 14.2% |
| Somalis | 0.0 /100 | #309 | Tragic 14.3% |
| Seminole | 0.0 /100 | #310 | Tragic 14.3% |
| Hondurans | 0.0 /100 | #311 | Tragic 14.3% |
| Choctaw | 0.0 /100 | #312 | Tragic 14.4% |
| Immigrants | Somalia | 0.0 /100 | #313 | Tragic 14.6% |
| Immigrants | Honduras | 0.0 /100 | #314 | Tragic 14.6% |
| Chippewa | 0.0 /100 | #315 | Tragic 14.6% |
| British West Indians | 0.0 /100 | #316 | Tragic 14.6% |
| Immigrants | Dominica | 0.0 /100 | #317 | Tragic 14.7% |
| Immigrants | Grenada | 0.0 /100 | #318 | Tragic 14.7% |
| U.S. Virgin Islanders | 0.0 /100 | #319 | Tragic 14.7% |
| Immigrants | Congo | 0.0 /100 | #320 | Tragic 14.7% |
| Arapaho | 0.0 /100 | #321 | Tragic 15.1% |