Cherokee vs French American Indian Male Poverty
COMPARE
Cherokee
French American Indian
Male Poverty
Male Poverty Comparison
Cherokee
French American Indians
13.1%
MALE POVERTY
0.1/ 100
METRIC RATING
259th/ 347
METRIC RANK
12.7%
MALE POVERTY
0.4/ 100
METRIC RATING
237th/ 347
METRIC RANK
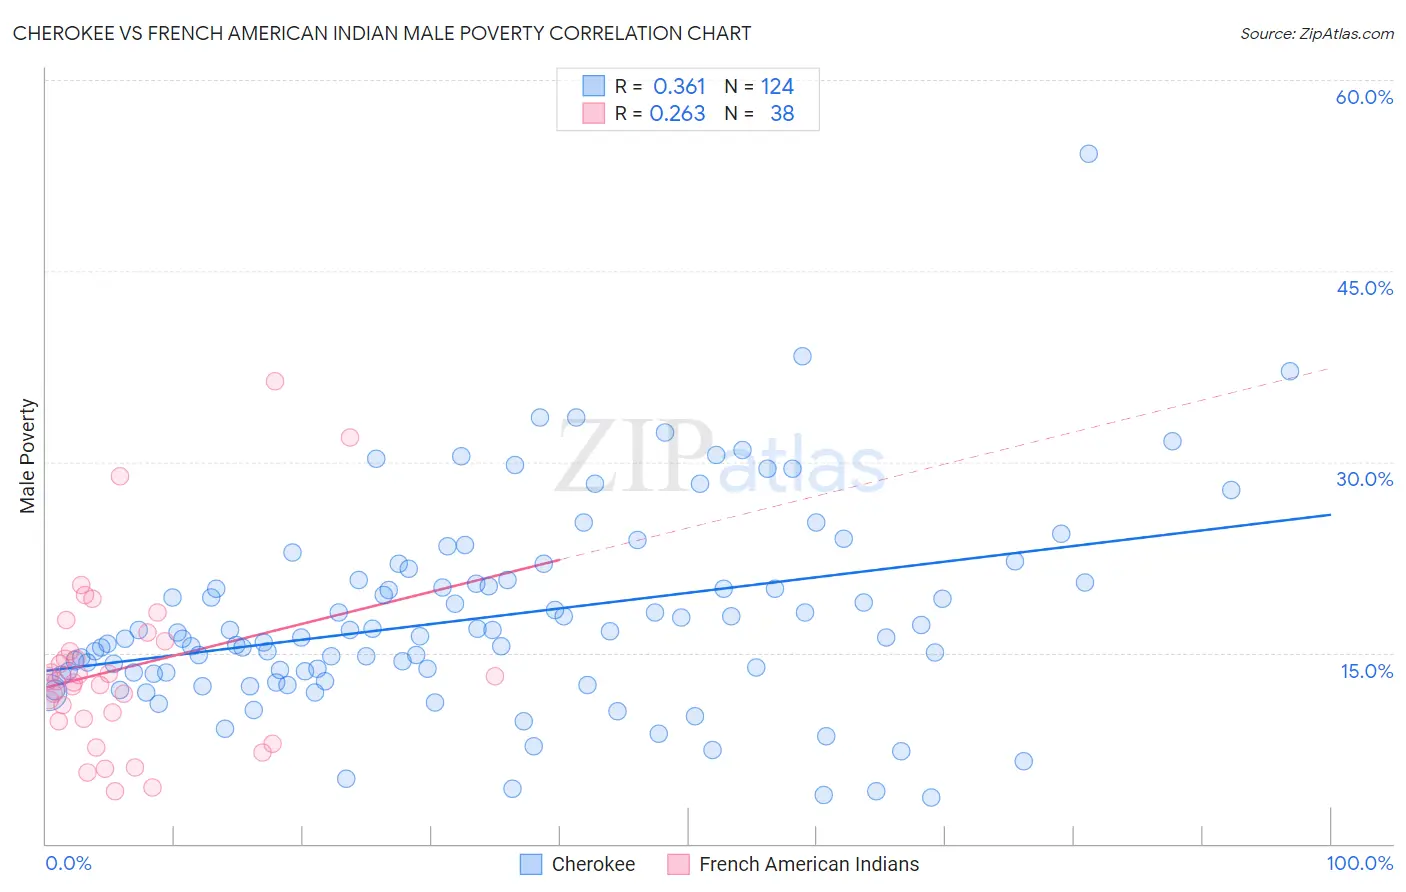
Cherokee vs French American Indian Male Poverty Correlation Chart
The statistical analysis conducted on geographies consisting of 493,122,545 people shows a mild positive correlation between the proportion of Cherokee and poverty level among males in the United States with a correlation coefficient (R) of 0.361 and weighted average of 13.1%. Similarly, the statistical analysis conducted on geographies consisting of 131,954,359 people shows a weak positive correlation between the proportion of French American Indians and poverty level among males in the United States with a correlation coefficient (R) of 0.263 and weighted average of 12.7%, a difference of 3.2%.
Male Poverty Correlation Summary
| Measurement | Cherokee | French American Indian |
| Minimum | 3.6% | 4.1% |
| Maximum | 54.2% | 36.3% |
| Range | 50.6% | 32.2% |
| Mean | 17.8% | 13.8% |
| Median | 16.3% | 12.9% |
| Interquartile 25% (IQ1) | 13.4% | 9.9% |
| Interquartile 75% (IQ3) | 20.6% | 15.9% |
| Interquartile Range (IQR) | 7.2% | 6.0% |
| Standard Deviation (Sample) | 7.8% | 6.9% |
| Standard Deviation (Population) | 7.8% | 6.8% |
Similar Demographics by Male Poverty
Demographics Similar to Cherokee by Male Poverty
In terms of male poverty, the demographic groups most similar to Cherokee are Ottawa (13.1%, a difference of 0.11%), Trinidadian and Tobagonian (13.1%, a difference of 0.13%), Cape Verdean (13.1%, a difference of 0.16%), Spanish American Indian (13.1%, a difference of 0.18%), and Immigrants from Trinidad and Tobago (13.1%, a difference of 0.29%).
| Demographics | Rating | Rank | Male Poverty |
| Immigrants | Ecuador | 0.2 /100 | #252 | Tragic 12.9% |
| Immigrants | Ghana | 0.2 /100 | #253 | Tragic 12.9% |
| Mexican American Indians | 0.1 /100 | #254 | Tragic 13.0% |
| Immigrants | Liberia | 0.1 /100 | #255 | Tragic 13.0% |
| Immigrants | Burma/Myanmar | 0.1 /100 | #256 | Tragic 13.0% |
| Immigrants | Trinidad and Tobago | 0.1 /100 | #257 | Tragic 13.1% |
| Cape Verdeans | 0.1 /100 | #258 | Tragic 13.1% |
| Cherokee | 0.1 /100 | #259 | Tragic 13.1% |
| Ottawa | 0.1 /100 | #260 | Tragic 13.1% |
| Trinidadians and Tobagonians | 0.1 /100 | #261 | Tragic 13.1% |
| Spanish American Indians | 0.1 /100 | #262 | Tragic 13.1% |
| Central Americans | 0.1 /100 | #263 | Tragic 13.2% |
| Iroquois | 0.1 /100 | #264 | Tragic 13.2% |
| Jamaicans | 0.1 /100 | #265 | Tragic 13.2% |
| Immigrants | Guyana | 0.1 /100 | #266 | Tragic 13.2% |
Demographics Similar to French American Indians by Male Poverty
In terms of male poverty, the demographic groups most similar to French American Indians are Ecuadorian (12.7%, a difference of 0.030%), Ghanaian (12.7%, a difference of 0.030%), Immigrants from Saudi Arabia (12.7%, a difference of 0.050%), Immigrants from Laos (12.6%, a difference of 0.29%), and Immigrants from Middle Africa (12.7%, a difference of 0.31%).
| Demographics | Rating | Rank | Male Poverty |
| Marshallese | 0.8 /100 | #230 | Tragic 12.5% |
| Salvadorans | 0.6 /100 | #231 | Tragic 12.6% |
| Nicaraguans | 0.6 /100 | #232 | Tragic 12.6% |
| Fijians | 0.6 /100 | #233 | Tragic 12.6% |
| Immigrants | Armenia | 0.6 /100 | #234 | Tragic 12.6% |
| Immigrants | Laos | 0.5 /100 | #235 | Tragic 12.6% |
| Immigrants | Saudi Arabia | 0.4 /100 | #236 | Tragic 12.7% |
| French American Indians | 0.4 /100 | #237 | Tragic 12.7% |
| Ecuadorians | 0.4 /100 | #238 | Tragic 12.7% |
| Ghanaians | 0.4 /100 | #239 | Tragic 12.7% |
| Immigrants | Middle Africa | 0.4 /100 | #240 | Tragic 12.7% |
| Sudanese | 0.3 /100 | #241 | Tragic 12.8% |
| Nepalese | 0.3 /100 | #242 | Tragic 12.8% |
| Alaskan Athabascans | 0.3 /100 | #243 | Tragic 12.8% |
| Tsimshian | 0.3 /100 | #244 | Tragic 12.8% |