Cherokee vs Basque Unemployment Among Women with Children Under 18 years
COMPARE
Cherokee
Basque
Unemployment Among Women with Children Under 18 years
Unemployment Among Women with Children Under 18 years Comparison
Cherokee
Basques
5.7%
UNEMPLOYMENT AMONG WOMEN WITH CHILDREN UNDER 18 YEARS
4.3/ 100
METRIC RATING
226th/ 347
METRIC RANK
5.3%
UNEMPLOYMENT AMONG WOMEN WITH CHILDREN UNDER 18 YEARS
86.5/ 100
METRIC RATING
119th/ 347
METRIC RANK
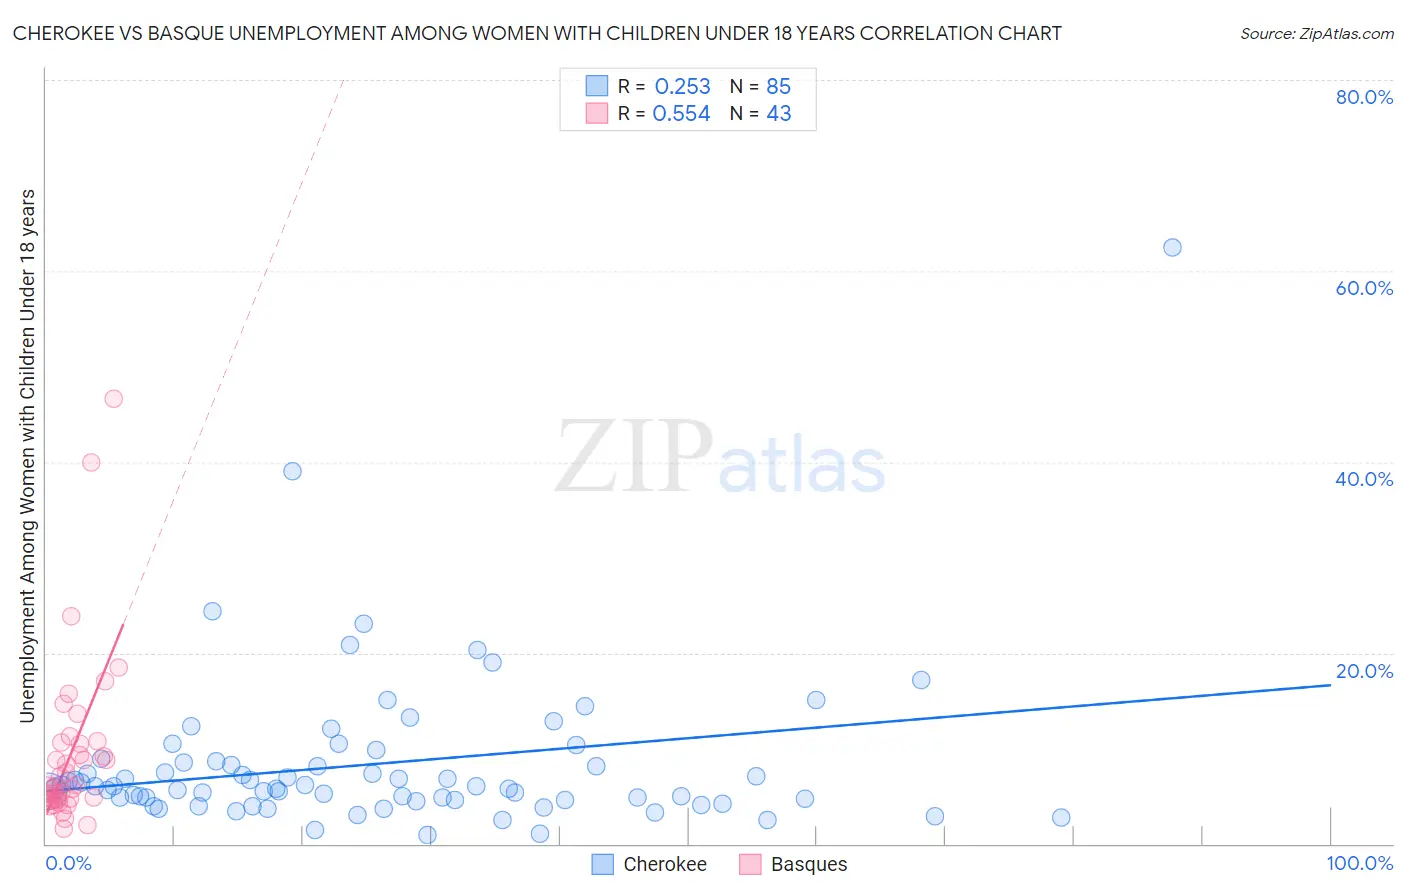
Cherokee vs Basque Unemployment Among Women with Children Under 18 years Correlation Chart
The statistical analysis conducted on geographies consisting of 460,921,532 people shows a weak positive correlation between the proportion of Cherokee and unemployment rate among women with children under the age of 18 in the United States with a correlation coefficient (R) of 0.253 and weighted average of 5.7%. Similarly, the statistical analysis conducted on geographies consisting of 162,382,106 people shows a substantial positive correlation between the proportion of Basques and unemployment rate among women with children under the age of 18 in the United States with a correlation coefficient (R) of 0.554 and weighted average of 5.3%, a difference of 9.1%.
Unemployment Among Women with Children Under 18 years Correlation Summary
| Measurement | Cherokee | Basque |
| Minimum | 0.95% | 1.5% |
| Maximum | 62.5% | 46.6% |
| Range | 61.6% | 45.1% |
| Mean | 8.4% | 9.4% |
| Median | 6.0% | 6.0% |
| Interquartile 25% (IQ1) | 4.6% | 4.7% |
| Interquartile 75% (IQ3) | 8.6% | 10.7% |
| Interquartile Range (IQR) | 4.0% | 6.0% |
| Standard Deviation (Sample) | 8.4% | 8.9% |
| Standard Deviation (Population) | 8.3% | 8.8% |
Similar Demographics by Unemployment Among Women with Children Under 18 years
Demographics Similar to Cherokee by Unemployment Among Women with Children Under 18 years
In terms of unemployment among women with children under 18 years, the demographic groups most similar to Cherokee are Armenian (5.7%, a difference of 0.070%), Immigrants from Syria (5.7%, a difference of 0.12%), Sierra Leonean (5.8%, a difference of 0.20%), Potawatomi (5.7%, a difference of 0.26%), and Osage (5.7%, a difference of 0.28%).
| Demographics | Rating | Rank | Unemployment Among Women with Children Under 18 years |
| Iroquois | 6.5 /100 | #219 | Tragic 5.7% |
| Immigrants | Fiji | 6.3 /100 | #220 | Tragic 5.7% |
| Pennsylvania Germans | 5.7 /100 | #221 | Tragic 5.7% |
| Osage | 5.0 /100 | #222 | Tragic 5.7% |
| Potawatomi | 5.0 /100 | #223 | Tragic 5.7% |
| Immigrants | Syria | 4.6 /100 | #224 | Tragic 5.7% |
| Armenians | 4.5 /100 | #225 | Tragic 5.7% |
| Cherokee | 4.3 /100 | #226 | Tragic 5.7% |
| Sierra Leoneans | 3.8 /100 | #227 | Tragic 5.8% |
| Somalis | 3.5 /100 | #228 | Tragic 5.8% |
| Immigrants | Panama | 3.4 /100 | #229 | Tragic 5.8% |
| Immigrants | South America | 3.2 /100 | #230 | Tragic 5.8% |
| Immigrants | Africa | 3.1 /100 | #231 | Tragic 5.8% |
| Creek | 3.1 /100 | #232 | Tragic 5.8% |
| Spanish Americans | 3.1 /100 | #233 | Tragic 5.8% |
Demographics Similar to Basques by Unemployment Among Women with Children Under 18 years
In terms of unemployment among women with children under 18 years, the demographic groups most similar to Basques are Egyptian (5.3%, a difference of 0.020%), Immigrants from Europe (5.3%, a difference of 0.030%), Immigrants from Romania (5.3%, a difference of 0.11%), Canadian (5.3%, a difference of 0.13%), and Scotch-Irish (5.3%, a difference of 0.13%).
| Demographics | Rating | Rank | Unemployment Among Women with Children Under 18 years |
| Immigrants | Eastern Europe | 88.5 /100 | #112 | Excellent 5.2% |
| French | 88.4 /100 | #113 | Excellent 5.2% |
| Kenyans | 88.2 /100 | #114 | Excellent 5.3% |
| Hungarians | 88.1 /100 | #115 | Excellent 5.3% |
| Macedonians | 87.7 /100 | #116 | Excellent 5.3% |
| Canadians | 87.4 /100 | #117 | Excellent 5.3% |
| Immigrants | Europe | 86.7 /100 | #118 | Excellent 5.3% |
| Basques | 86.5 /100 | #119 | Excellent 5.3% |
| Egyptians | 86.4 /100 | #120 | Excellent 5.3% |
| Immigrants | Romania | 85.8 /100 | #121 | Excellent 5.3% |
| Scotch-Irish | 85.7 /100 | #122 | Excellent 5.3% |
| Sudanese | 84.3 /100 | #123 | Excellent 5.3% |
| Native Hawaiians | 84.0 /100 | #124 | Excellent 5.3% |
| Immigrants | North Macedonia | 83.2 /100 | #125 | Excellent 5.3% |
| Immigrants | Oceania | 83.1 /100 | #126 | Excellent 5.3% |