Chippewa vs Northern European Male Poverty
COMPARE
Chippewa
Northern European
Male Poverty
Male Poverty Comparison
Chippewa
Northern Europeans
14.6%
MALE POVERTY
0.0/ 100
METRIC RATING
315th/ 347
METRIC RANK
10.4%
MALE POVERTY
95.2/ 100
METRIC RATING
87th/ 347
METRIC RANK
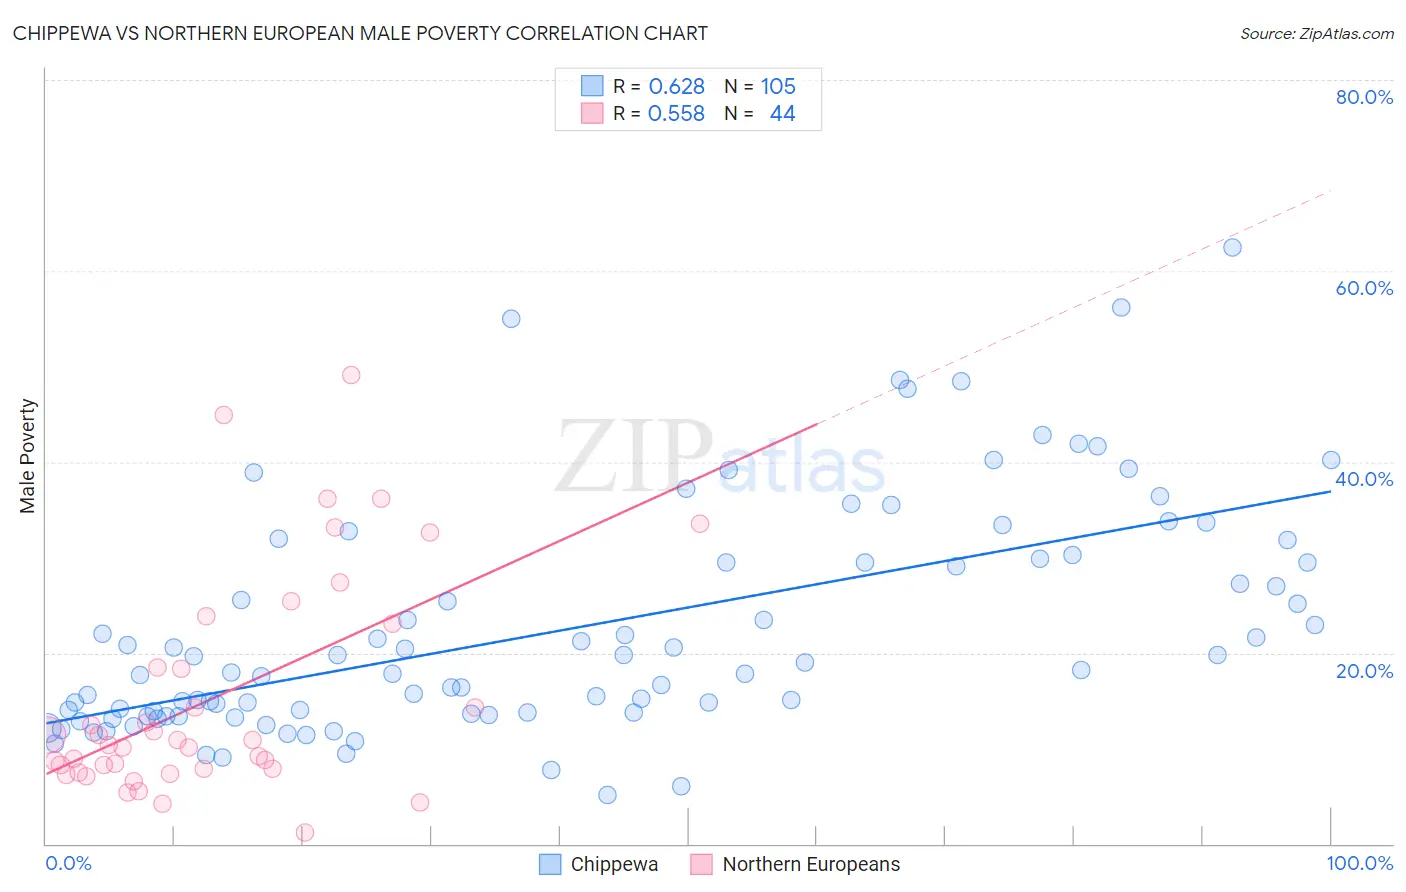
Chippewa vs Northern European Male Poverty Correlation Chart
The statistical analysis conducted on geographies consisting of 214,985,801 people shows a significant positive correlation between the proportion of Chippewa and poverty level among males in the United States with a correlation coefficient (R) of 0.628 and weighted average of 14.6%. Similarly, the statistical analysis conducted on geographies consisting of 405,718,489 people shows a substantial positive correlation between the proportion of Northern Europeans and poverty level among males in the United States with a correlation coefficient (R) of 0.558 and weighted average of 10.4%, a difference of 40.8%.
Male Poverty Correlation Summary
| Measurement | Chippewa | Northern European |
| Minimum | 5.1% | 1.2% |
| Maximum | 62.5% | 49.1% |
| Range | 57.4% | 47.9% |
| Mean | 22.5% | 15.3% |
| Median | 18.2% | 10.6% |
| Interquartile 25% (IQ1) | 13.6% | 7.9% |
| Interquartile 75% (IQ3) | 29.7% | 20.7% |
| Interquartile Range (IQR) | 16.0% | 12.9% |
| Standard Deviation (Sample) | 12.0% | 11.6% |
| Standard Deviation (Population) | 11.9% | 11.5% |
Similar Demographics by Male Poverty
Demographics Similar to Chippewa by Male Poverty
In terms of male poverty, the demographic groups most similar to Chippewa are British West Indian (14.6%, a difference of 0.020%), Immigrants from Honduras (14.6%, a difference of 0.080%), Immigrants from Somalia (14.6%, a difference of 0.11%), Immigrants from Dominica (14.7%, a difference of 0.70%), and Immigrants from Grenada (14.7%, a difference of 0.76%).
| Demographics | Rating | Rank | Male Poverty |
| Africans | 0.0 /100 | #308 | Tragic 14.2% |
| Somalis | 0.0 /100 | #309 | Tragic 14.3% |
| Seminole | 0.0 /100 | #310 | Tragic 14.3% |
| Hondurans | 0.0 /100 | #311 | Tragic 14.3% |
| Choctaw | 0.0 /100 | #312 | Tragic 14.4% |
| Immigrants | Somalia | 0.0 /100 | #313 | Tragic 14.6% |
| Immigrants | Honduras | 0.0 /100 | #314 | Tragic 14.6% |
| Chippewa | 0.0 /100 | #315 | Tragic 14.6% |
| British West Indians | 0.0 /100 | #316 | Tragic 14.6% |
| Immigrants | Dominica | 0.0 /100 | #317 | Tragic 14.7% |
| Immigrants | Grenada | 0.0 /100 | #318 | Tragic 14.7% |
| U.S. Virgin Islanders | 0.0 /100 | #319 | Tragic 14.7% |
| Immigrants | Congo | 0.0 /100 | #320 | Tragic 14.7% |
| Arapaho | 0.0 /100 | #321 | Tragic 15.1% |
| Kiowa | 0.0 /100 | #322 | Tragic 15.2% |
Demographics Similar to Northern Europeans by Male Poverty
In terms of male poverty, the demographic groups most similar to Northern Europeans are Immigrants from Eastern Asia (10.4%, a difference of 0.040%), Cambodian (10.4%, a difference of 0.14%), Immigrants from Denmark (10.4%, a difference of 0.14%), Immigrants from England (10.4%, a difference of 0.17%), and Indian (Asian) (10.4%, a difference of 0.17%).
| Demographics | Rating | Rank | Male Poverty |
| English | 96.4 /100 | #80 | Exceptional 10.3% |
| Belgians | 95.9 /100 | #81 | Exceptional 10.3% |
| Egyptians | 95.9 /100 | #82 | Exceptional 10.3% |
| Immigrants | Sweden | 95.7 /100 | #83 | Exceptional 10.3% |
| Czechoslovakians | 95.6 /100 | #84 | Exceptional 10.3% |
| Immigrants | England | 95.5 /100 | #85 | Exceptional 10.4% |
| Immigrants | Eastern Asia | 95.3 /100 | #86 | Exceptional 10.4% |
| Northern Europeans | 95.2 /100 | #87 | Exceptional 10.4% |
| Cambodians | 95.0 /100 | #88 | Exceptional 10.4% |
| Immigrants | Denmark | 95.0 /100 | #89 | Exceptional 10.4% |
| Indians (Asian) | 94.9 /100 | #90 | Exceptional 10.4% |
| British | 94.8 /100 | #91 | Exceptional 10.4% |
| Jordanians | 94.4 /100 | #92 | Exceptional 10.4% |
| Australians | 94.4 /100 | #93 | Exceptional 10.4% |
| Immigrants | South Africa | 94.1 /100 | #94 | Exceptional 10.4% |