Bermudan vs Northern European Male Poverty
COMPARE
Bermudan
Northern European
Male Poverty
Male Poverty Comparison
Bermudans
Northern Europeans
12.2%
MALE POVERTY
2.4/ 100
METRIC RATING
219th/ 347
METRIC RANK
10.4%
MALE POVERTY
95.2/ 100
METRIC RATING
87th/ 347
METRIC RANK
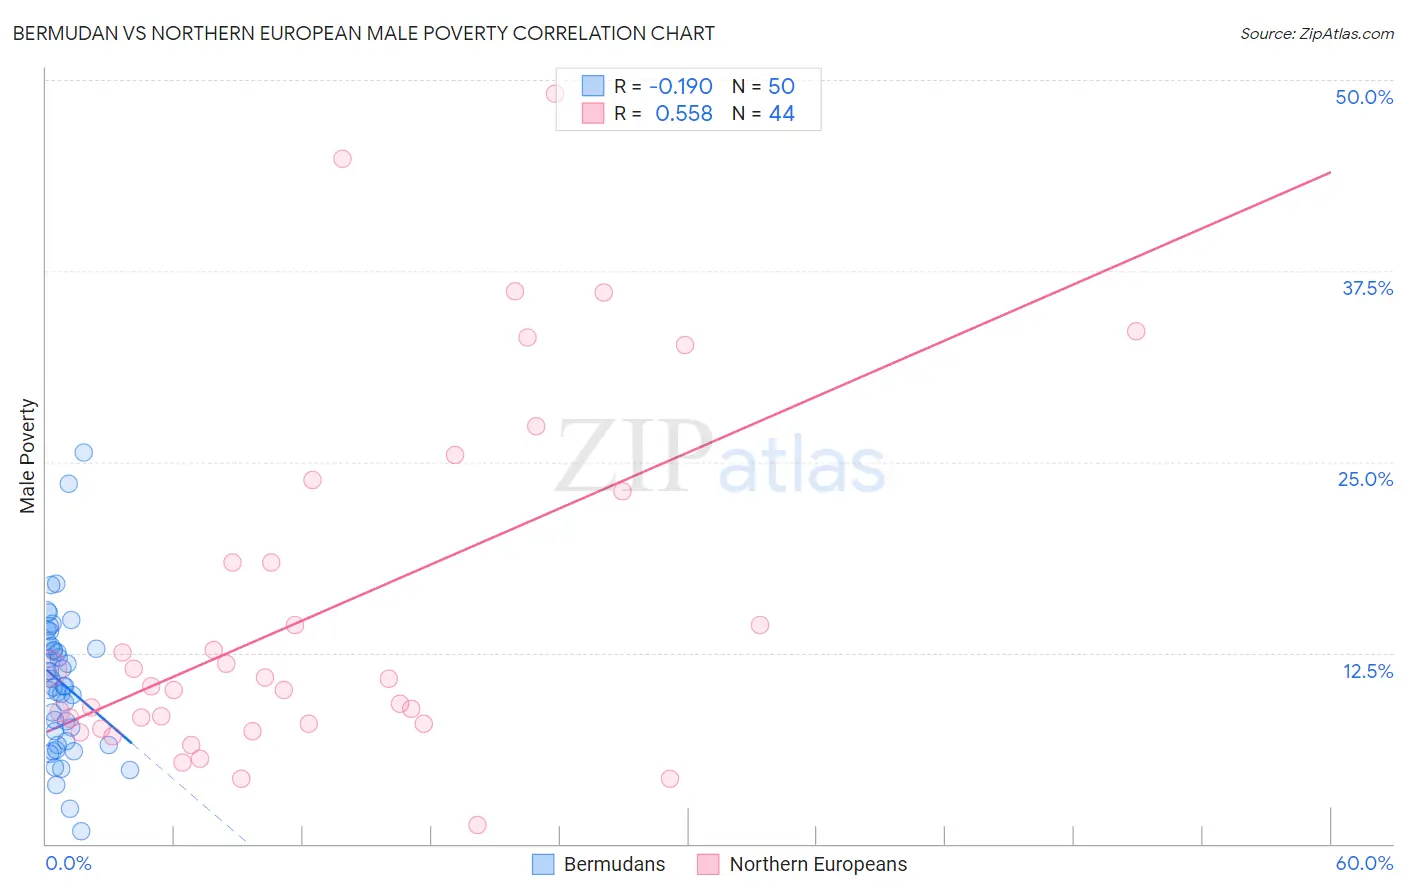
Bermudan vs Northern European Male Poverty Correlation Chart
The statistical analysis conducted on geographies consisting of 55,715,607 people shows a poor negative correlation between the proportion of Bermudans and poverty level among males in the United States with a correlation coefficient (R) of -0.190 and weighted average of 12.2%. Similarly, the statistical analysis conducted on geographies consisting of 405,718,489 people shows a substantial positive correlation between the proportion of Northern Europeans and poverty level among males in the United States with a correlation coefficient (R) of 0.558 and weighted average of 10.4%, a difference of 17.7%.
Male Poverty Correlation Summary
| Measurement | Bermudan | Northern European |
| Minimum | 0.81% | 1.2% |
| Maximum | 25.6% | 49.1% |
| Range | 24.8% | 47.9% |
| Mean | 10.5% | 15.3% |
| Median | 10.3% | 10.6% |
| Interquartile 25% (IQ1) | 6.7% | 7.9% |
| Interquartile 75% (IQ3) | 12.9% | 20.7% |
| Interquartile Range (IQR) | 6.2% | 12.9% |
| Standard Deviation (Sample) | 4.7% | 11.6% |
| Standard Deviation (Population) | 4.7% | 11.5% |
Similar Demographics by Male Poverty
Demographics Similar to Bermudans by Male Poverty
In terms of male poverty, the demographic groups most similar to Bermudans are Immigrants from Eritrea (12.2%, a difference of 0.020%), German Russian (12.2%, a difference of 0.070%), Immigrants from Thailand (12.2%, a difference of 0.090%), Immigrants from Cambodia (12.2%, a difference of 0.10%), and Immigrants from Uzbekistan (12.2%, a difference of 0.18%).
| Demographics | Rating | Rank | Male Poverty |
| Americans | 3.2 /100 | #212 | Tragic 12.1% |
| Immigrants | Nonimmigrants | 3.1 /100 | #213 | Tragic 12.1% |
| Japanese | 2.7 /100 | #214 | Tragic 12.2% |
| Immigrants | Uzbekistan | 2.6 /100 | #215 | Tragic 12.2% |
| Immigrants | Cambodia | 2.5 /100 | #216 | Tragic 12.2% |
| Immigrants | Thailand | 2.5 /100 | #217 | Tragic 12.2% |
| German Russians | 2.5 /100 | #218 | Tragic 12.2% |
| Bermudans | 2.4 /100 | #219 | Tragic 12.2% |
| Immigrants | Eritrea | 2.4 /100 | #220 | Tragic 12.2% |
| Ugandans | 2.2 /100 | #221 | Tragic 12.2% |
| Immigrants | Africa | 2.1 /100 | #222 | Tragic 12.2% |
| Immigrants | Micronesia | 2.1 /100 | #223 | Tragic 12.2% |
| Immigrants | Nigeria | 1.6 /100 | #224 | Tragic 12.3% |
| Osage | 1.5 /100 | #225 | Tragic 12.3% |
| Nigerians | 1.4 /100 | #226 | Tragic 12.3% |
Demographics Similar to Northern Europeans by Male Poverty
In terms of male poverty, the demographic groups most similar to Northern Europeans are Immigrants from Eastern Asia (10.4%, a difference of 0.040%), Cambodian (10.4%, a difference of 0.14%), Immigrants from Denmark (10.4%, a difference of 0.14%), Immigrants from England (10.4%, a difference of 0.17%), and Indian (Asian) (10.4%, a difference of 0.17%).
| Demographics | Rating | Rank | Male Poverty |
| English | 96.4 /100 | #80 | Exceptional 10.3% |
| Belgians | 95.9 /100 | #81 | Exceptional 10.3% |
| Egyptians | 95.9 /100 | #82 | Exceptional 10.3% |
| Immigrants | Sweden | 95.7 /100 | #83 | Exceptional 10.3% |
| Czechoslovakians | 95.6 /100 | #84 | Exceptional 10.3% |
| Immigrants | England | 95.5 /100 | #85 | Exceptional 10.4% |
| Immigrants | Eastern Asia | 95.3 /100 | #86 | Exceptional 10.4% |
| Northern Europeans | 95.2 /100 | #87 | Exceptional 10.4% |
| Cambodians | 95.0 /100 | #88 | Exceptional 10.4% |
| Immigrants | Denmark | 95.0 /100 | #89 | Exceptional 10.4% |
| Indians (Asian) | 94.9 /100 | #90 | Exceptional 10.4% |
| British | 94.8 /100 | #91 | Exceptional 10.4% |
| Jordanians | 94.4 /100 | #92 | Exceptional 10.4% |
| Australians | 94.4 /100 | #93 | Exceptional 10.4% |
| Immigrants | South Africa | 94.1 /100 | #94 | Exceptional 10.4% |