Immigrants from Southern Europe vs Northern European Male Poverty
COMPARE
Immigrants from Southern Europe
Northern European
Male Poverty
Male Poverty Comparison
Immigrants from Southern Europe
Northern Europeans
10.5%
MALE POVERTY
91.3/ 100
METRIC RATING
106th/ 347
METRIC RANK
10.4%
MALE POVERTY
95.2/ 100
METRIC RATING
87th/ 347
METRIC RANK
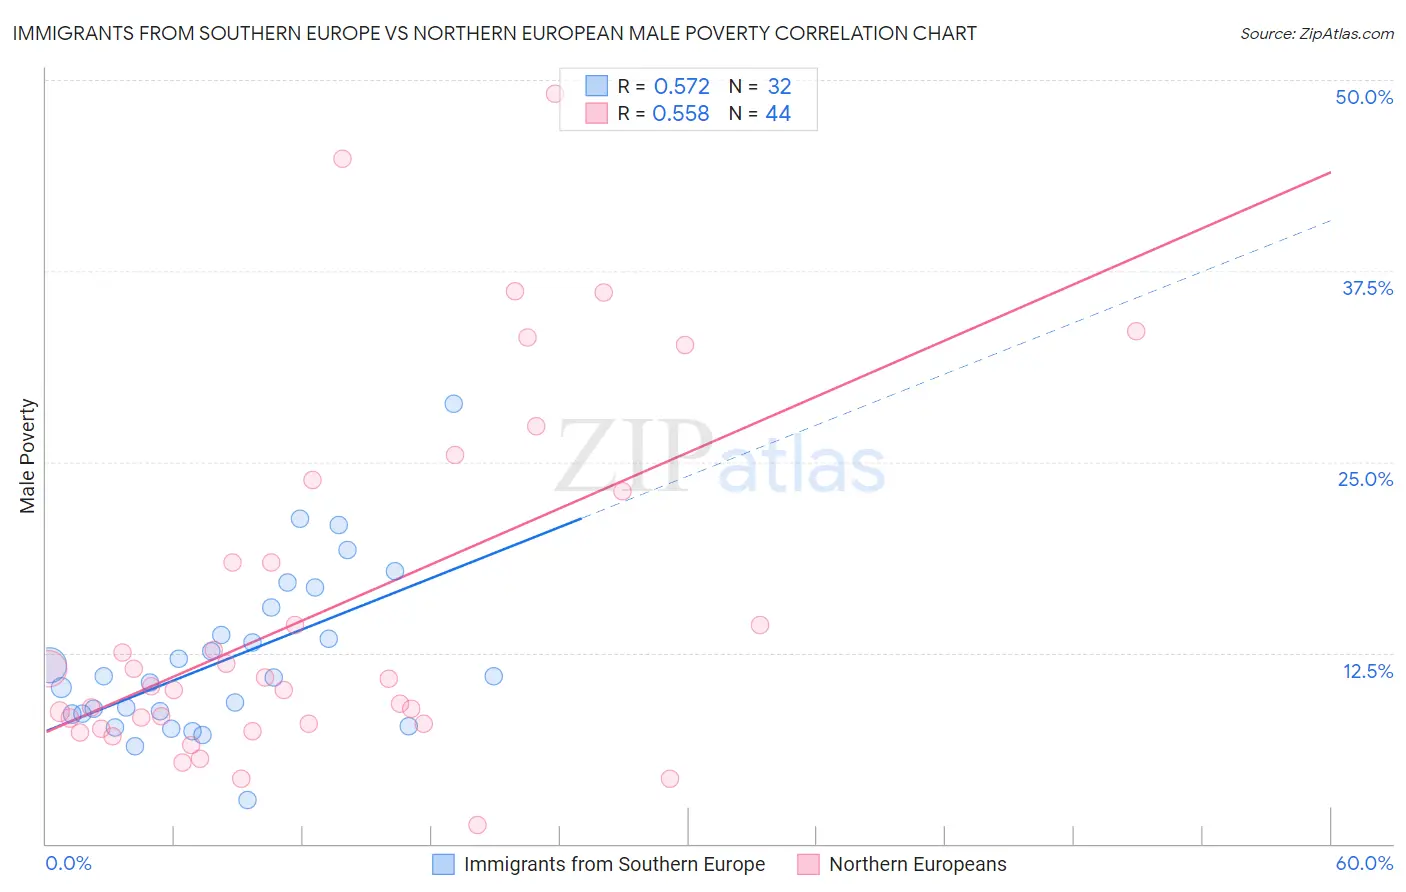
Immigrants from Southern Europe vs Northern European Male Poverty Correlation Chart
The statistical analysis conducted on geographies consisting of 402,406,508 people shows a substantial positive correlation between the proportion of Immigrants from Southern Europe and poverty level among males in the United States with a correlation coefficient (R) of 0.572 and weighted average of 10.5%. Similarly, the statistical analysis conducted on geographies consisting of 405,718,489 people shows a substantial positive correlation between the proportion of Northern Europeans and poverty level among males in the United States with a correlation coefficient (R) of 0.558 and weighted average of 10.4%, a difference of 1.7%.
Male Poverty Correlation Summary
| Measurement | Immigrants from Southern Europe | Northern European |
| Minimum | 2.9% | 1.2% |
| Maximum | 28.8% | 49.1% |
| Range | 25.9% | 47.9% |
| Mean | 12.1% | 15.3% |
| Median | 10.9% | 10.6% |
| Interquartile 25% (IQ1) | 8.5% | 7.9% |
| Interquartile 75% (IQ3) | 14.6% | 20.7% |
| Interquartile Range (IQR) | 6.1% | 12.9% |
| Standard Deviation (Sample) | 5.4% | 11.6% |
| Standard Deviation (Population) | 5.3% | 11.5% |
Demographics Similar to Immigrants from Southern Europe and Northern Europeans by Male Poverty
In terms of male poverty, the demographic groups most similar to Immigrants from Southern Europe are Canadian (10.5%, a difference of 0.11%), Welsh (10.5%, a difference of 0.12%), Slavic (10.5%, a difference of 0.13%), French Canadian (10.5%, a difference of 0.23%), and Immigrants from Zimbabwe (10.5%, a difference of 0.24%). Similarly, the demographic groups most similar to Northern Europeans are Immigrants from Eastern Asia (10.4%, a difference of 0.040%), Cambodian (10.4%, a difference of 0.14%), Immigrants from Denmark (10.4%, a difference of 0.14%), Indian (Asian) (10.4%, a difference of 0.17%), and British (10.4%, a difference of 0.24%).
| Demographics | Rating | Rank | Male Poverty |
| Immigrants | Eastern Asia | 95.3 /100 | #86 | Exceptional 10.4% |
| Northern Europeans | 95.2 /100 | #87 | Exceptional 10.4% |
| Cambodians | 95.0 /100 | #88 | Exceptional 10.4% |
| Immigrants | Denmark | 95.0 /100 | #89 | Exceptional 10.4% |
| Indians (Asian) | 94.9 /100 | #90 | Exceptional 10.4% |
| British | 94.8 /100 | #91 | Exceptional 10.4% |
| Jordanians | 94.4 /100 | #92 | Exceptional 10.4% |
| Australians | 94.4 /100 | #93 | Exceptional 10.4% |
| Immigrants | South Africa | 94.1 /100 | #94 | Exceptional 10.4% |
| Scottish | 94.0 /100 | #95 | Exceptional 10.4% |
| Immigrants | Egypt | 93.7 /100 | #96 | Exceptional 10.4% |
| Romanians | 93.6 /100 | #97 | Exceptional 10.5% |
| Finns | 93.4 /100 | #98 | Exceptional 10.5% |
| Immigrants | Indonesia | 93.3 /100 | #99 | Exceptional 10.5% |
| Immigrants | Latvia | 92.8 /100 | #100 | Exceptional 10.5% |
| Immigrants | Zimbabwe | 92.0 /100 | #101 | Exceptional 10.5% |
| French Canadians | 91.9 /100 | #102 | Exceptional 10.5% |
| Slavs | 91.7 /100 | #103 | Exceptional 10.5% |
| Welsh | 91.6 /100 | #104 | Exceptional 10.5% |
| Canadians | 91.6 /100 | #105 | Exceptional 10.5% |
| Immigrants | Southern Europe | 91.3 /100 | #106 | Exceptional 10.5% |