Celtic vs Indian (Asian) Married-Couple Family Poverty
COMPARE
Celtic
Indian (Asian)
Married-Couple Family Poverty
Married-Couple Family Poverty Comparison
Celtics
Indians (Asian)
4.8%
MARRIED-COUPLE FAMILY POVERTY
94.8/ 100
METRIC RATING
116th/ 347
METRIC RANK
4.8%
MARRIED-COUPLE FAMILY POVERTY
93.2/ 100
METRIC RATING
121st/ 347
METRIC RANK
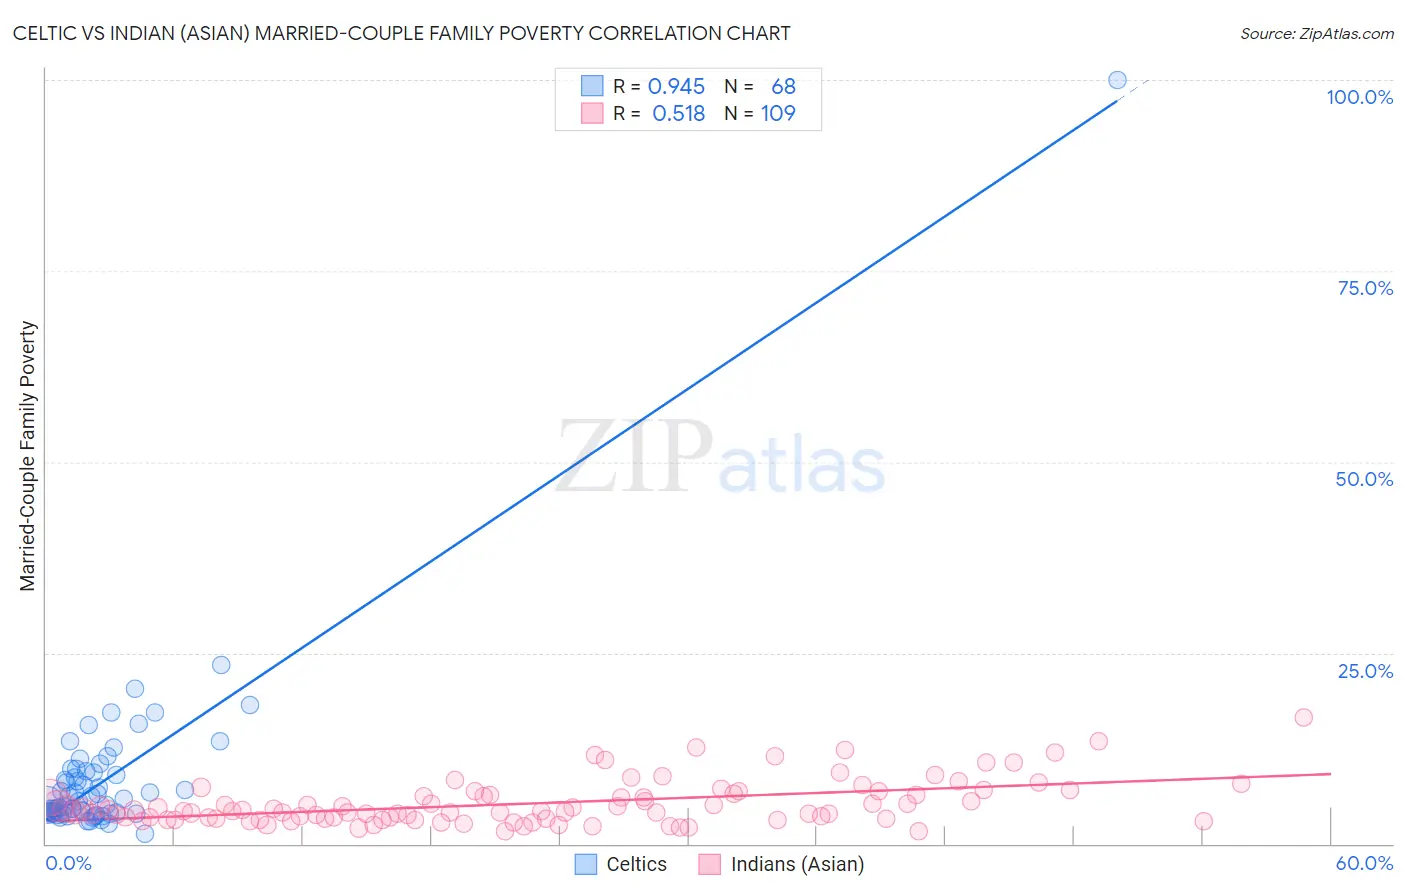
Celtic vs Indian (Asian) Married-Couple Family Poverty Correlation Chart
The statistical analysis conducted on geographies consisting of 167,973,280 people shows a near-perfect positive correlation between the proportion of Celtics and poverty level among married-couple families in the United States with a correlation coefficient (R) of 0.945 and weighted average of 4.8%. Similarly, the statistical analysis conducted on geographies consisting of 487,935,416 people shows a substantial positive correlation between the proportion of Indians (Asian) and poverty level among married-couple families in the United States with a correlation coefficient (R) of 0.518 and weighted average of 4.8%, a difference of 0.90%.
Married-Couple Family Poverty Correlation Summary
| Measurement | Celtic | Indian (Asian) |
| Minimum | 1.3% | 1.7% |
| Maximum | 100.0% | 16.6% |
| Range | 98.7% | 14.9% |
| Mean | 8.7% | 5.3% |
| Median | 5.4% | 4.3% |
| Interquartile 25% (IQ1) | 4.1% | 3.3% |
| Interquartile 75% (IQ3) | 9.4% | 6.5% |
| Interquartile Range (IQR) | 5.4% | 3.2% |
| Standard Deviation (Sample) | 12.2% | 2.9% |
| Standard Deviation (Population) | 12.1% | 2.9% |
Demographics Similar to Celtics and Indians (Asian) by Married-Couple Family Poverty
In terms of married-couple family poverty, the demographic groups most similar to Celtics are Taiwanese (4.8%, a difference of 0.010%), Kenyan (4.8%, a difference of 0.10%), Immigrants from Philippines (4.8%, a difference of 0.12%), Immigrants from Indonesia (4.8%, a difference of 0.16%), and Immigrants from Eastern Asia (4.8%, a difference of 0.48%). Similarly, the demographic groups most similar to Indians (Asian) are White/Caucasian (4.8%, a difference of 0.050%), Jordanian (4.8%, a difference of 0.060%), Immigrants from Southern Europe (4.8%, a difference of 0.090%), Romanian (4.8%, a difference of 0.33%), and Immigrants from Bosnia and Herzegovina (4.8%, a difference of 0.35%).
| Demographics | Rating | Rank | Married-Couple Family Poverty |
| Laotians | 96.6 /100 | #108 | Exceptional 4.7% |
| Immigrants | Hong Kong | 96.4 /100 | #109 | Exceptional 4.7% |
| Immigrants | Bolivia | 96.2 /100 | #110 | Exceptional 4.7% |
| Pakistanis | 96.2 /100 | #111 | Exceptional 4.7% |
| Tongans | 95.9 /100 | #112 | Exceptional 4.7% |
| Immigrants | Nepal | 95.9 /100 | #113 | Exceptional 4.7% |
| Immigrants | Indonesia | 95.1 /100 | #114 | Exceptional 4.8% |
| Taiwanese | 94.8 /100 | #115 | Exceptional 4.8% |
| Celtics | 94.8 /100 | #116 | Exceptional 4.8% |
| Kenyans | 94.7 /100 | #117 | Exceptional 4.8% |
| Immigrants | Philippines | 94.6 /100 | #118 | Exceptional 4.8% |
| Immigrants | Eastern Asia | 94.0 /100 | #119 | Exceptional 4.8% |
| Immigrants | Southern Europe | 93.4 /100 | #120 | Exceptional 4.8% |
| Indians (Asian) | 93.2 /100 | #121 | Exceptional 4.8% |
| Whites/Caucasians | 93.1 /100 | #122 | Exceptional 4.8% |
| Jordanians | 93.1 /100 | #123 | Exceptional 4.8% |
| Romanians | 92.5 /100 | #124 | Exceptional 4.8% |
| Immigrants | Bosnia and Herzegovina | 92.5 /100 | #125 | Exceptional 4.8% |
| Immigrants | Asia | 92.3 /100 | #126 | Exceptional 4.8% |
| Egyptians | 92.0 /100 | #127 | Exceptional 4.8% |
| Palestinians | 91.2 /100 | #128 | Exceptional 4.9% |