Celtic vs Indian (Asian) 8th Grade
COMPARE
Celtic
Indian (Asian)
8th Grade
8th Grade Comparison
Celtics
Indians (Asian)
96.8%
8TH GRADE
99.9/ 100
METRIC RATING
51st/ 347
METRIC RANK
95.2%
8TH GRADE
3.3/ 100
METRIC RATING
232nd/ 347
METRIC RANK
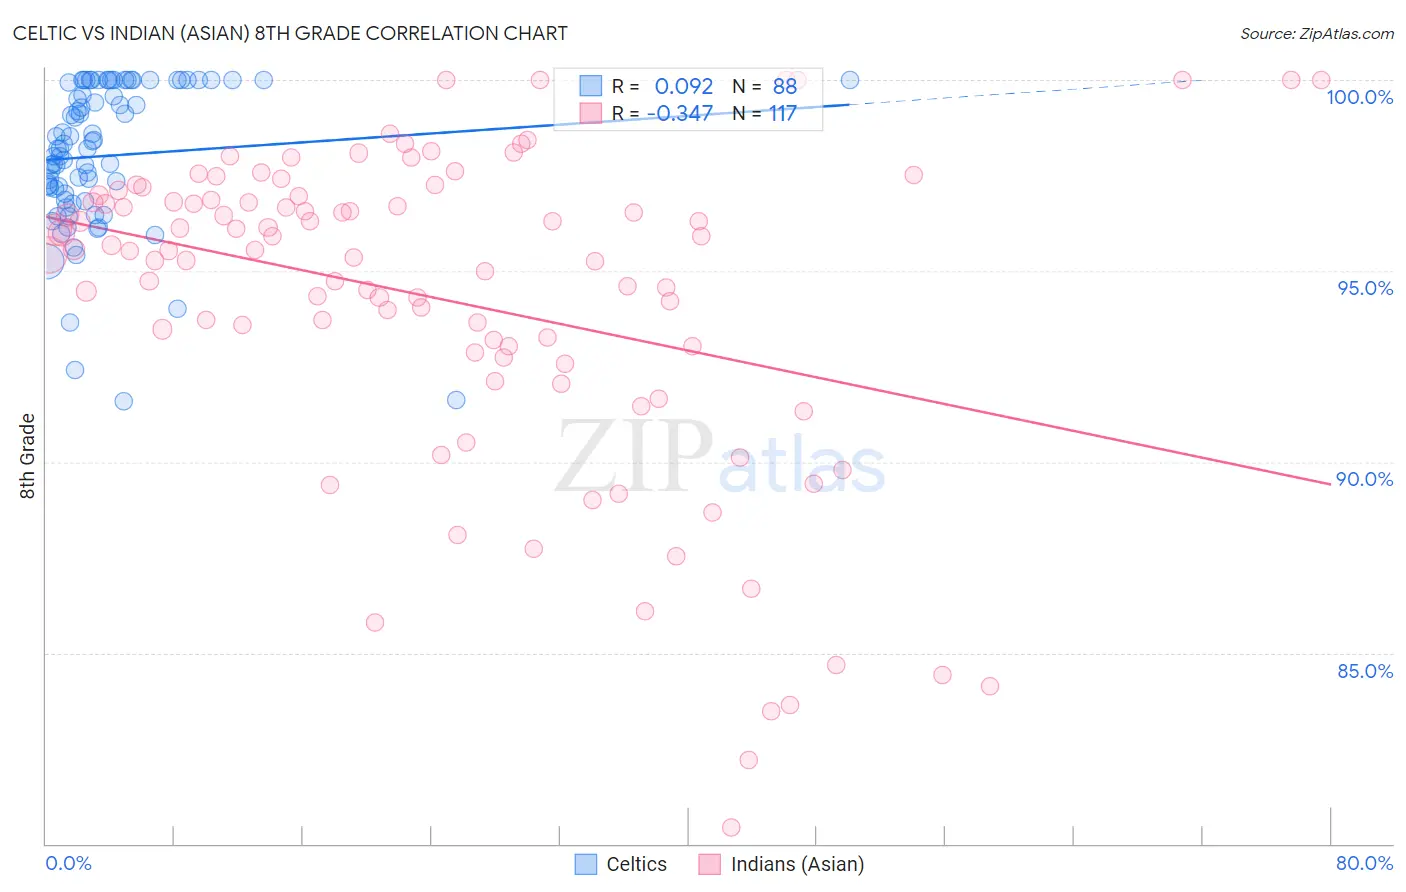
Celtic vs Indian (Asian) 8th Grade Correlation Chart
The statistical analysis conducted on geographies consisting of 168,876,981 people shows a slight positive correlation between the proportion of Celtics and percentage of population with at least 8th grade education in the United States with a correlation coefficient (R) of 0.092 and weighted average of 96.8%. Similarly, the statistical analysis conducted on geographies consisting of 495,348,182 people shows a mild negative correlation between the proportion of Indians (Asian) and percentage of population with at least 8th grade education in the United States with a correlation coefficient (R) of -0.347 and weighted average of 95.2%, a difference of 1.7%.
8th Grade Correlation Summary
| Measurement | Celtic | Indian (Asian) |
| Minimum | 91.6% | 80.4% |
| Maximum | 100.0% | 100.0% |
| Range | 8.4% | 19.6% |
| Mean | 98.0% | 94.3% |
| Median | 98.2% | 95.5% |
| Interquartile 25% (IQ1) | 96.9% | 92.8% |
| Interquartile 75% (IQ3) | 100.0% | 96.9% |
| Interquartile Range (IQR) | 3.1% | 4.1% |
| Standard Deviation (Sample) | 1.9% | 4.2% |
| Standard Deviation (Population) | 1.9% | 4.2% |
Similar Demographics by 8th Grade
Demographics Similar to Celtics by 8th Grade
In terms of 8th grade, the demographic groups most similar to Celtics are Immigrants from Scotland (96.8%, a difference of 0.010%), Estonian (96.8%, a difference of 0.020%), Slavic (96.8%, a difference of 0.030%), Greek (96.8%, a difference of 0.030%), and Austrian (96.7%, a difference of 0.050%).
| Demographics | Rating | Rank | 8th Grade |
| Maltese | 99.9 /100 | #44 | Exceptional 96.9% |
| Northern Europeans | 99.9 /100 | #45 | Exceptional 96.9% |
| Czechoslovakians | 99.9 /100 | #46 | Exceptional 96.9% |
| Bulgarians | 99.9 /100 | #47 | Exceptional 96.9% |
| Slavs | 99.9 /100 | #48 | Exceptional 96.8% |
| Estonians | 99.9 /100 | #49 | Exceptional 96.8% |
| Immigrants | Scotland | 99.9 /100 | #50 | Exceptional 96.8% |
| Celtics | 99.9 /100 | #51 | Exceptional 96.8% |
| Greeks | 99.9 /100 | #52 | Exceptional 96.8% |
| Austrians | 99.9 /100 | #53 | Exceptional 96.7% |
| Serbians | 99.8 /100 | #54 | Exceptional 96.7% |
| Russians | 99.8 /100 | #55 | Exceptional 96.7% |
| Australians | 99.8 /100 | #56 | Exceptional 96.7% |
| Macedonians | 99.8 /100 | #57 | Exceptional 96.7% |
| Immigrants | Canada | 99.8 /100 | #58 | Exceptional 96.7% |
Demographics Similar to Indians (Asian) by 8th Grade
In terms of 8th grade, the demographic groups most similar to Indians (Asian) are Asian (95.2%, a difference of 0.010%), Immigrants from Asia (95.2%, a difference of 0.010%), Costa Rican (95.2%, a difference of 0.020%), Nigerian (95.2%, a difference of 0.020%), and Immigrants from Panama (95.2%, a difference of 0.030%).
| Demographics | Rating | Rank | 8th Grade |
| Sub-Saharan Africans | 6.0 /100 | #225 | Tragic 95.3% |
| Navajo | 5.7 /100 | #226 | Tragic 95.3% |
| Bahamians | 5.6 /100 | #227 | Tragic 95.3% |
| Immigrants | Eastern Africa | 5.6 /100 | #228 | Tragic 95.3% |
| Immigrants | Indonesia | 4.4 /100 | #229 | Tragic 95.3% |
| Immigrants | Panama | 4.1 /100 | #230 | Tragic 95.2% |
| Asians | 3.5 /100 | #231 | Tragic 95.2% |
| Indians (Asian) | 3.3 /100 | #232 | Tragic 95.2% |
| Immigrants | Asia | 3.1 /100 | #233 | Tragic 95.2% |
| Costa Ricans | 3.0 /100 | #234 | Tragic 95.2% |
| Nigerians | 2.9 /100 | #235 | Tragic 95.2% |
| Senegalese | 2.7 /100 | #236 | Tragic 95.2% |
| Immigrants | Africa | 2.7 /100 | #237 | Tragic 95.2% |
| Natives/Alaskans | 2.3 /100 | #238 | Tragic 95.2% |
| Immigrants | Sierra Leone | 2.1 /100 | #239 | Tragic 95.1% |