Celtic vs Immigrants from Eritrea Female Unemployment
COMPARE
Celtic
Immigrants from Eritrea
Female Unemployment
Female Unemployment Comparison
Celtics
Immigrants from Eritrea
4.9%
FEMALE UNEMPLOYMENT
98.5/ 100
METRIC RATING
64th/ 347
METRIC RANK
5.1%
FEMALE UNEMPLOYMENT
84.6/ 100
METRIC RATING
134th/ 347
METRIC RANK
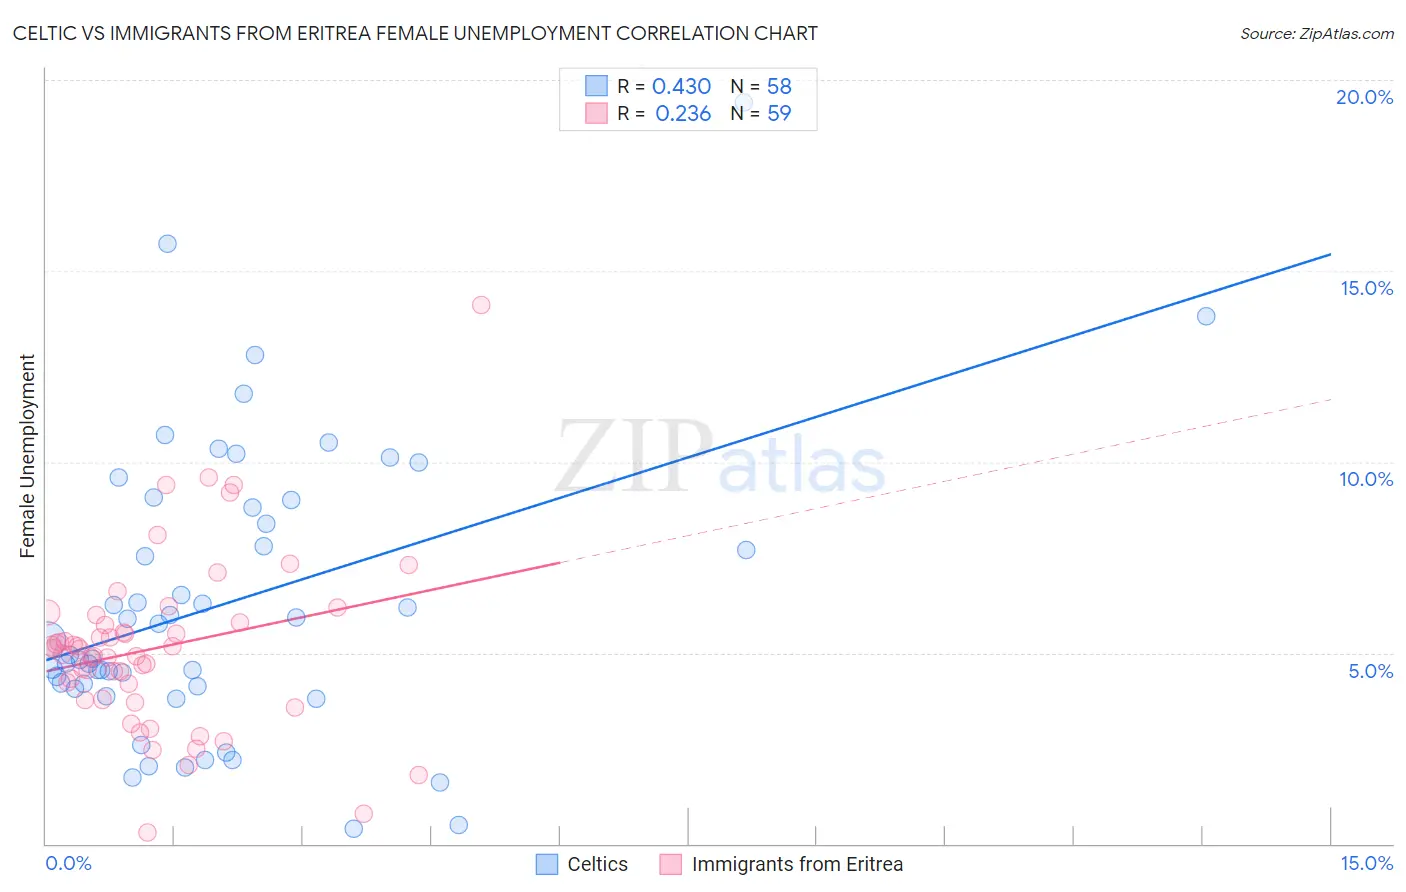
Celtic vs Immigrants from Eritrea Female Unemployment Correlation Chart
The statistical analysis conducted on geographies consisting of 168,426,082 people shows a moderate positive correlation between the proportion of Celtics and unemploymnet rate among females in the United States with a correlation coefficient (R) of 0.430 and weighted average of 4.9%. Similarly, the statistical analysis conducted on geographies consisting of 104,834,311 people shows a weak positive correlation between the proportion of Immigrants from Eritrea and unemploymnet rate among females in the United States with a correlation coefficient (R) of 0.236 and weighted average of 5.1%, a difference of 4.0%.
Female Unemployment Correlation Summary
| Measurement | Celtic | Immigrants from Eritrea |
| Minimum | 0.40% | 0.30% |
| Maximum | 19.4% | 14.1% |
| Range | 19.0% | 13.8% |
| Mean | 6.3% | 5.1% |
| Median | 5.1% | 5.1% |
| Interquartile 25% (IQ1) | 4.1% | 3.8% |
| Interquartile 75% (IQ3) | 8.8% | 5.8% |
| Interquartile Range (IQR) | 4.7% | 2.0% |
| Standard Deviation (Sample) | 3.8% | 2.3% |
| Standard Deviation (Population) | 3.7% | 2.2% |
Similar Demographics by Female Unemployment
Demographics Similar to Celtics by Female Unemployment
In terms of female unemployment, the demographic groups most similar to Celtics are Immigrants from Belgium (4.9%, a difference of 0.0%), Immigrants from Canada (4.9%, a difference of 0.12%), Immigrants from Nepal (4.9%, a difference of 0.12%), Immigrants from Scotland (4.9%, a difference of 0.13%), and Immigrants from North America (4.9%, a difference of 0.19%).
| Demographics | Rating | Rank | Female Unemployment |
| Icelanders | 98.8 /100 | #57 | Exceptional 4.9% |
| Immigrants | Lithuania | 98.8 /100 | #58 | Exceptional 4.9% |
| Bhutanese | 98.7 /100 | #59 | Exceptional 4.9% |
| Immigrants | Scotland | 98.6 /100 | #60 | Exceptional 4.9% |
| Immigrants | Canada | 98.6 /100 | #61 | Exceptional 4.9% |
| Immigrants | Nepal | 98.6 /100 | #62 | Exceptional 4.9% |
| Immigrants | Belgium | 98.5 /100 | #63 | Exceptional 4.9% |
| Celtics | 98.5 /100 | #64 | Exceptional 4.9% |
| Immigrants | North America | 98.3 /100 | #65 | Exceptional 4.9% |
| Hungarians | 98.3 /100 | #66 | Exceptional 4.9% |
| Cubans | 98.3 /100 | #67 | Exceptional 4.9% |
| Tlingit-Haida | 98.3 /100 | #68 | Exceptional 4.9% |
| Immigrants | Ireland | 98.2 /100 | #69 | Exceptional 4.9% |
| Osage | 98.2 /100 | #70 | Exceptional 4.9% |
| German Russians | 98.1 /100 | #71 | Exceptional 4.9% |
Demographics Similar to Immigrants from Eritrea by Female Unemployment
In terms of female unemployment, the demographic groups most similar to Immigrants from Eritrea are Immigrants from Latvia (5.1%, a difference of 0.0%), Immigrants from Hong Kong (5.1%, a difference of 0.020%), Immigrants from Sri Lanka (5.1%, a difference of 0.040%), Indian (Asian) (5.1%, a difference of 0.050%), and Immigrants from Ethiopia (5.1%, a difference of 0.090%).
| Demographics | Rating | Rank | Female Unemployment |
| Immigrants | Hungary | 86.0 /100 | #127 | Excellent 5.1% |
| Chileans | 85.8 /100 | #128 | Excellent 5.1% |
| Ethiopians | 85.7 /100 | #129 | Excellent 5.1% |
| Maltese | 85.5 /100 | #130 | Excellent 5.1% |
| Immigrants | Ethiopia | 85.4 /100 | #131 | Excellent 5.1% |
| Immigrants | Sri Lanka | 85.0 /100 | #132 | Excellent 5.1% |
| Immigrants | Hong Kong | 84.8 /100 | #133 | Excellent 5.1% |
| Immigrants | Eritrea | 84.6 /100 | #134 | Excellent 5.1% |
| Immigrants | Latvia | 84.6 /100 | #135 | Excellent 5.1% |
| Indians (Asian) | 84.2 /100 | #136 | Excellent 5.1% |
| Pakistanis | 83.8 /100 | #137 | Excellent 5.1% |
| Chickasaw | 83.2 /100 | #138 | Excellent 5.1% |
| Immigrants | Eastern Asia | 83.0 /100 | #139 | Excellent 5.1% |
| Immigrants | France | 82.7 /100 | #140 | Excellent 5.1% |
| Immigrants | Eastern Europe | 81.5 /100 | #141 | Excellent 5.1% |