Celtic vs Immigrants from Haiti Female Poverty
COMPARE
Celtic
Immigrants from Haiti
Female Poverty
Female Poverty Comparison
Celtics
Immigrants from Haiti
13.4%
FEMALE POVERTY
49.9/ 100
METRIC RATING
175th/ 347
METRIC RANK
16.1%
FEMALE POVERTY
0.0/ 100
METRIC RATING
282nd/ 347
METRIC RANK
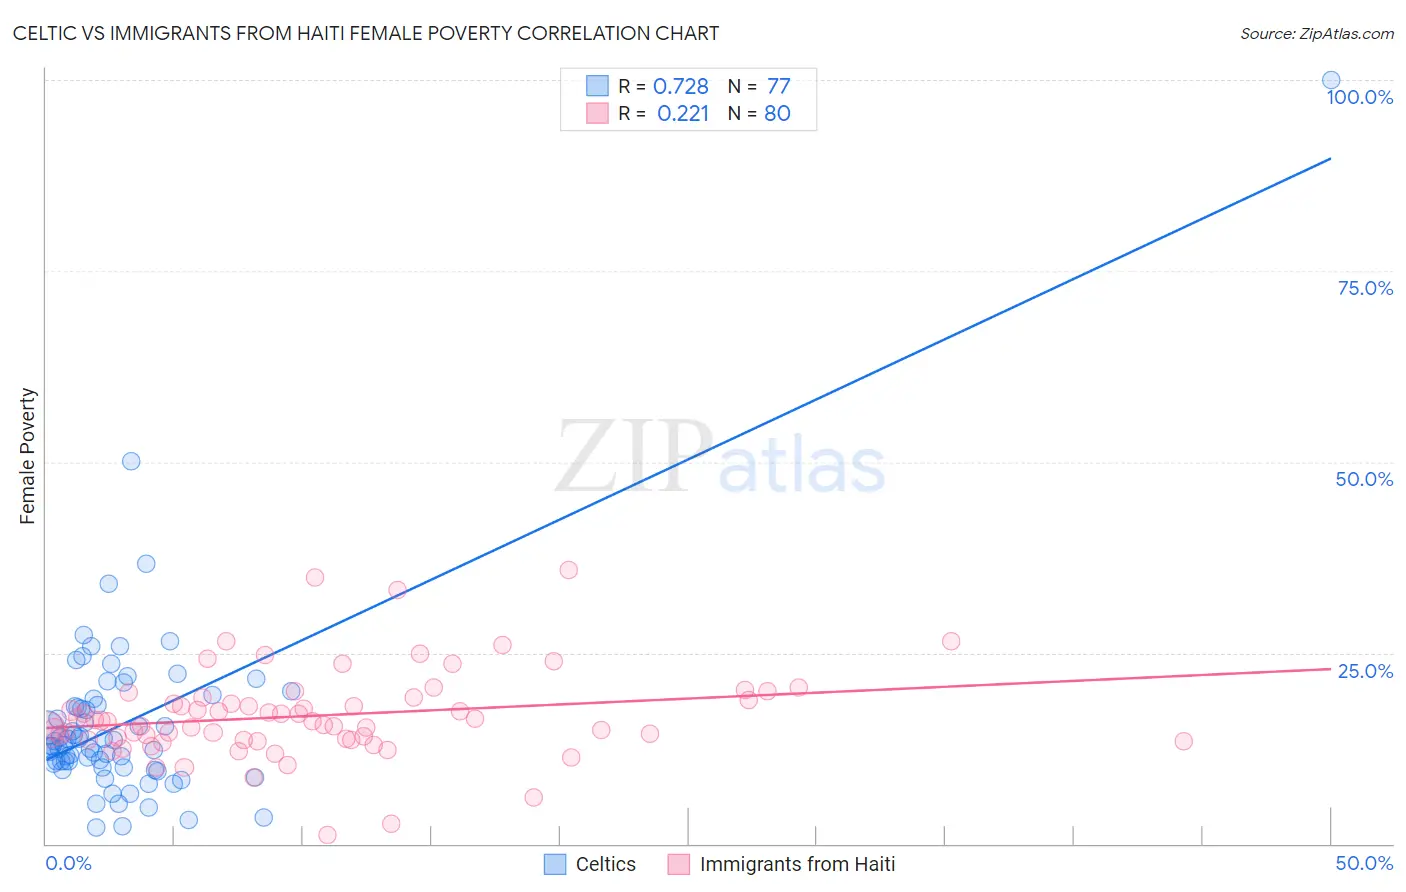
Celtic vs Immigrants from Haiti Female Poverty Correlation Chart
The statistical analysis conducted on geographies consisting of 168,846,795 people shows a strong positive correlation between the proportion of Celtics and poverty level among females in the United States with a correlation coefficient (R) of 0.728 and weighted average of 13.4%. Similarly, the statistical analysis conducted on geographies consisting of 225,156,546 people shows a weak positive correlation between the proportion of Immigrants from Haiti and poverty level among females in the United States with a correlation coefficient (R) of 0.221 and weighted average of 16.1%, a difference of 20.0%.
Female Poverty Correlation Summary
| Measurement | Celtic | Immigrants from Haiti |
| Minimum | 2.2% | 1.1% |
| Maximum | 100.0% | 35.8% |
| Range | 97.8% | 34.7% |
| Mean | 15.9% | 16.8% |
| Median | 12.9% | 16.0% |
| Interquartile 25% (IQ1) | 10.3% | 13.6% |
| Interquartile 75% (IQ3) | 18.6% | 19.0% |
| Interquartile Range (IQR) | 8.3% | 5.3% |
| Standard Deviation (Sample) | 12.5% | 5.9% |
| Standard Deviation (Population) | 12.5% | 5.9% |
Similar Demographics by Female Poverty
Demographics Similar to Celtics by Female Poverty
In terms of female poverty, the demographic groups most similar to Celtics are Immigrants from Spain (13.4%, a difference of 0.0%), Immigrants from Iraq (13.4%, a difference of 0.010%), Immigrants from Morocco (13.4%, a difference of 0.050%), Immigrants from Afghanistan (13.4%, a difference of 0.080%), and Israeli (13.5%, a difference of 0.080%).
| Demographics | Rating | Rank | Female Poverty |
| Aleuts | 56.7 /100 | #168 | Average 13.4% |
| Lebanese | 55.9 /100 | #169 | Average 13.4% |
| Colombians | 55.7 /100 | #170 | Average 13.4% |
| Whites/Caucasians | 54.6 /100 | #171 | Average 13.4% |
| Mongolians | 53.6 /100 | #172 | Average 13.4% |
| Immigrants | Afghanistan | 50.8 /100 | #173 | Average 13.4% |
| Immigrants | Iraq | 50.0 /100 | #174 | Average 13.4% |
| Celtics | 49.9 /100 | #175 | Average 13.4% |
| Immigrants | Spain | 49.9 /100 | #176 | Average 13.4% |
| Immigrants | Morocco | 49.4 /100 | #177 | Average 13.4% |
| Israelis | 49.1 /100 | #178 | Average 13.5% |
| Immigrants | Syria | 48.8 /100 | #179 | Average 13.5% |
| South Americans | 44.8 /100 | #180 | Average 13.5% |
| Venezuelans | 44.5 /100 | #181 | Average 13.5% |
| Immigrants | Colombia | 44.5 /100 | #182 | Average 13.5% |
Demographics Similar to Immigrants from Haiti by Female Poverty
In terms of female poverty, the demographic groups most similar to Immigrants from Haiti are Immigrants from Cuba (16.1%, a difference of 0.080%), Spanish American (16.2%, a difference of 0.13%), West Indian (16.1%, a difference of 0.15%), Vietnamese (16.1%, a difference of 0.17%), and Comanche (16.2%, a difference of 0.21%).
| Demographics | Rating | Rank | Female Poverty |
| Immigrants | Barbados | 0.0 /100 | #275 | Tragic 16.0% |
| Central Americans | 0.0 /100 | #276 | Tragic 16.0% |
| Bangladeshis | 0.0 /100 | #277 | Tragic 16.0% |
| Immigrants | West Indies | 0.0 /100 | #278 | Tragic 16.1% |
| Immigrants | Bahamas | 0.0 /100 | #279 | Tragic 16.1% |
| Vietnamese | 0.0 /100 | #280 | Tragic 16.1% |
| West Indians | 0.0 /100 | #281 | Tragic 16.1% |
| Immigrants | Haiti | 0.0 /100 | #282 | Tragic 16.1% |
| Immigrants | Cuba | 0.0 /100 | #283 | Tragic 16.1% |
| Spanish Americans | 0.0 /100 | #284 | Tragic 16.2% |
| Comanche | 0.0 /100 | #285 | Tragic 16.2% |
| Inupiat | 0.0 /100 | #286 | Tragic 16.2% |
| Immigrants | Belize | 0.0 /100 | #287 | Tragic 16.3% |
| Indonesians | 0.0 /100 | #288 | Tragic 16.4% |
| Blackfeet | 0.0 /100 | #289 | Tragic 16.4% |