Ugandan vs Immigrants from Ecuador Family Poverty
COMPARE
Ugandan
Immigrants from Ecuador
Family Poverty
Family Poverty Comparison
Ugandans
Immigrants from Ecuador
9.3%
FAMILY POVERTY
28.7/ 100
METRIC RATING
191st/ 347
METRIC RANK
11.1%
FAMILY POVERTY
0.1/ 100
METRIC RATING
269th/ 347
METRIC RANK
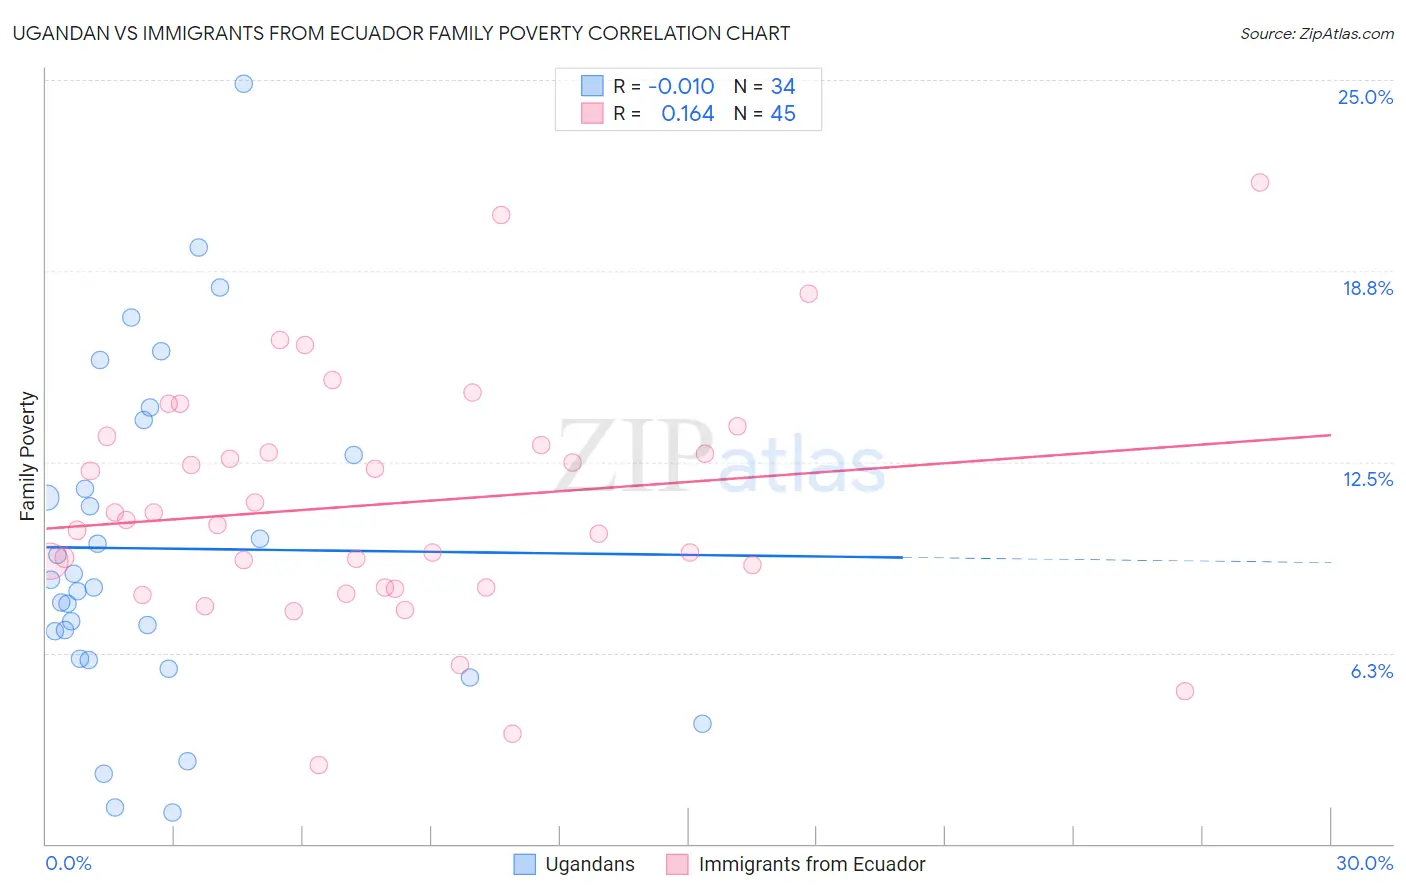
Ugandan vs Immigrants from Ecuador Family Poverty Correlation Chart
The statistical analysis conducted on geographies consisting of 93,955,553 people shows no correlation between the proportion of Ugandans and poverty level among families in the United States with a correlation coefficient (R) of -0.010 and weighted average of 9.3%. Similarly, the statistical analysis conducted on geographies consisting of 270,551,219 people shows a poor positive correlation between the proportion of Immigrants from Ecuador and poverty level among families in the United States with a correlation coefficient (R) of 0.164 and weighted average of 11.1%, a difference of 19.8%.
Family Poverty Correlation Summary
| Measurement | Ugandan | Immigrants from Ecuador |
| Minimum | 1.0% | 2.6% |
| Maximum | 24.9% | 21.7% |
| Range | 23.8% | 19.1% |
| Mean | 9.7% | 11.1% |
| Median | 8.5% | 10.6% |
| Interquartile 25% (IQ1) | 6.0% | 8.4% |
| Interquartile 75% (IQ3) | 12.7% | 13.2% |
| Interquartile Range (IQR) | 6.7% | 4.8% |
| Standard Deviation (Sample) | 5.4% | 3.9% |
| Standard Deviation (Population) | 5.4% | 3.9% |
Similar Demographics by Family Poverty
Demographics Similar to Ugandans by Family Poverty
In terms of family poverty, the demographic groups most similar to Ugandans are Spanish (9.3%, a difference of 0.010%), Immigrants from Western Asia (9.3%, a difference of 0.080%), South American (9.3%, a difference of 0.10%), Venezuelan (9.3%, a difference of 0.22%), and Arab (9.2%, a difference of 0.41%).
| Demographics | Rating | Rank | Family Poverty |
| South American Indians | 38.7 /100 | #184 | Fair 9.1% |
| Immigrants | Saudi Arabia | 38.6 /100 | #185 | Fair 9.1% |
| Colombians | 36.1 /100 | #186 | Fair 9.2% |
| Delaware | 35.4 /100 | #187 | Fair 9.2% |
| Immigrants | Kenya | 34.0 /100 | #188 | Fair 9.2% |
| Immigrants | Afghanistan | 32.1 /100 | #189 | Fair 9.2% |
| Arabs | 31.5 /100 | #190 | Fair 9.2% |
| Ugandans | 28.7 /100 | #191 | Fair 9.3% |
| Spanish | 28.7 /100 | #192 | Fair 9.3% |
| Immigrants | Western Asia | 28.2 /100 | #193 | Fair 9.3% |
| South Americans | 28.1 /100 | #194 | Fair 9.3% |
| Venezuelans | 27.4 /100 | #195 | Fair 9.3% |
| Immigrants | Venezuela | 26.1 /100 | #196 | Fair 9.3% |
| Immigrants | Colombia | 24.4 /100 | #197 | Fair 9.3% |
| Iraqis | 24.2 /100 | #198 | Fair 9.3% |
Demographics Similar to Immigrants from Ecuador by Family Poverty
In terms of family poverty, the demographic groups most similar to Immigrants from Ecuador are Immigrants from Nicaragua (11.1%, a difference of 0.010%), Immigrants from Bahamas (11.1%, a difference of 0.25%), Immigrants from Jamaica (11.2%, a difference of 0.35%), Jamaican (11.1%, a difference of 0.48%), and Comanche (11.0%, a difference of 0.58%).
| Demographics | Rating | Rank | Family Poverty |
| Spanish American Indians | 0.2 /100 | #262 | Tragic 10.9% |
| Cape Verdeans | 0.1 /100 | #263 | Tragic 10.9% |
| Trinidadians and Tobagonians | 0.1 /100 | #264 | Tragic 10.9% |
| Immigrants | Trinidad and Tobago | 0.1 /100 | #265 | Tragic 10.9% |
| Immigrants | El Salvador | 0.1 /100 | #266 | Tragic 11.0% |
| Comanche | 0.1 /100 | #267 | Tragic 11.0% |
| Jamaicans | 0.1 /100 | #268 | Tragic 11.1% |
| Immigrants | Ecuador | 0.1 /100 | #269 | Tragic 11.1% |
| Immigrants | Nicaragua | 0.1 /100 | #270 | Tragic 11.1% |
| Immigrants | Bahamas | 0.1 /100 | #271 | Tragic 11.1% |
| Immigrants | Jamaica | 0.1 /100 | #272 | Tragic 11.2% |
| Somalis | 0.1 /100 | #273 | Tragic 11.2% |
| Spanish Americans | 0.1 /100 | #274 | Tragic 11.2% |
| Central Americans | 0.1 /100 | #275 | Tragic 11.2% |
| Immigrants | Guyana | 0.1 /100 | #276 | Tragic 11.2% |