Sudanese vs Immigrants from Ecuador Family Poverty
COMPARE
Sudanese
Immigrants from Ecuador
Family Poverty
Family Poverty Comparison
Sudanese
Immigrants from Ecuador
10.0%
FAMILY POVERTY
3.1/ 100
METRIC RATING
228th/ 347
METRIC RANK
11.1%
FAMILY POVERTY
0.1/ 100
METRIC RATING
269th/ 347
METRIC RANK
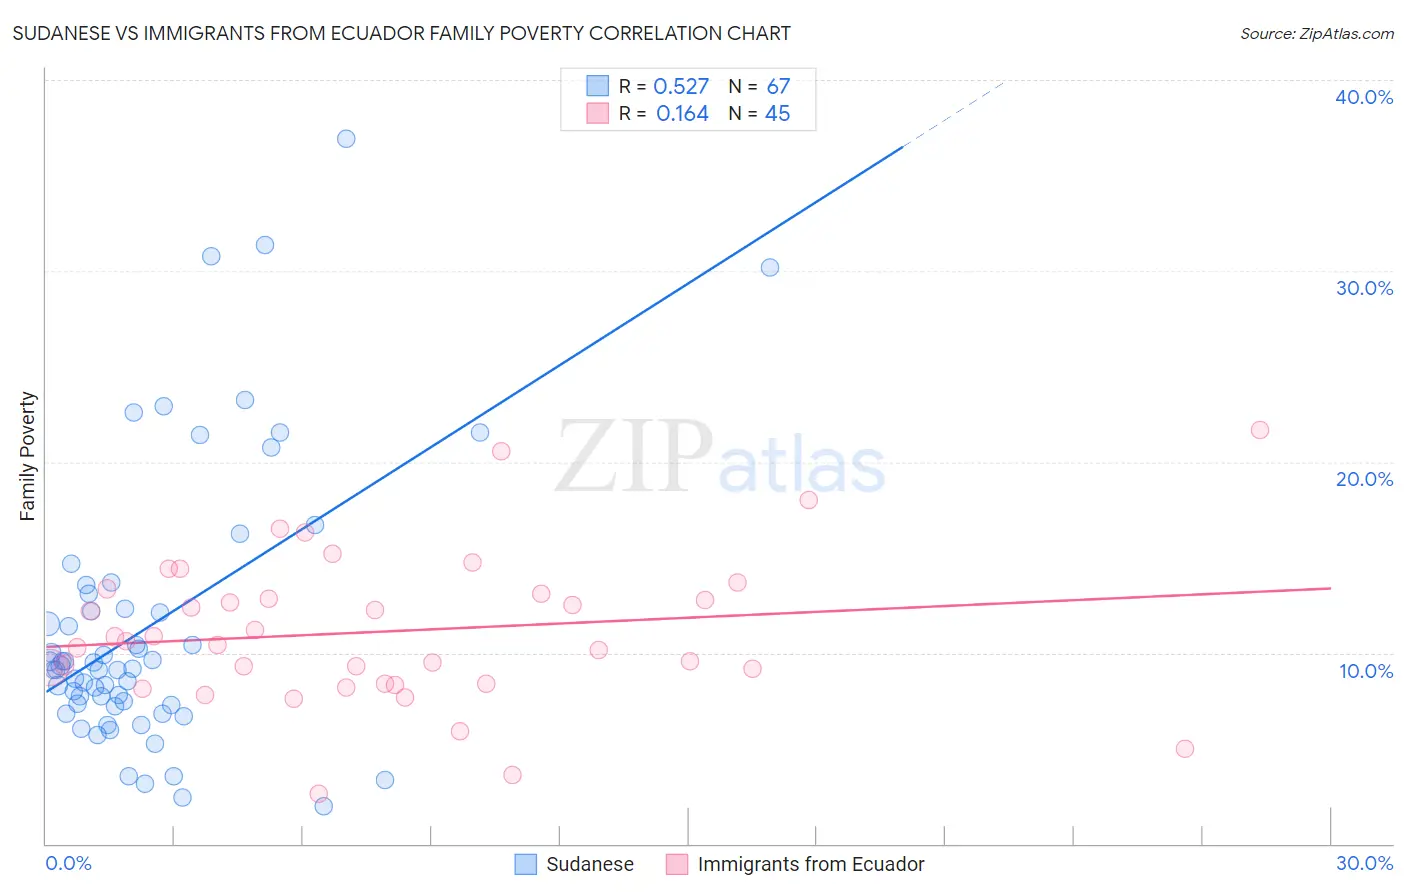
Sudanese vs Immigrants from Ecuador Family Poverty Correlation Chart
The statistical analysis conducted on geographies consisting of 110,085,531 people shows a substantial positive correlation between the proportion of Sudanese and poverty level among families in the United States with a correlation coefficient (R) of 0.527 and weighted average of 10.0%. Similarly, the statistical analysis conducted on geographies consisting of 270,551,219 people shows a poor positive correlation between the proportion of Immigrants from Ecuador and poverty level among families in the United States with a correlation coefficient (R) of 0.164 and weighted average of 11.1%, a difference of 10.9%.
Family Poverty Correlation Summary
| Measurement | Sudanese | Immigrants from Ecuador |
| Minimum | 1.9% | 2.6% |
| Maximum | 36.9% | 21.7% |
| Range | 35.0% | 19.1% |
| Mean | 11.5% | 11.1% |
| Median | 9.2% | 10.6% |
| Interquartile 25% (IQ1) | 7.3% | 8.4% |
| Interquartile 75% (IQ3) | 13.1% | 13.2% |
| Interquartile Range (IQR) | 5.8% | 4.8% |
| Standard Deviation (Sample) | 7.3% | 3.9% |
| Standard Deviation (Population) | 7.3% | 3.9% |
Similar Demographics by Family Poverty
Demographics Similar to Sudanese by Family Poverty
In terms of family poverty, the demographic groups most similar to Sudanese are Immigrants from Uzbekistan (10.0%, a difference of 0.010%), Immigrants from Panama (10.0%, a difference of 0.030%), Immigrants from Armenia (10.0%, a difference of 0.20%), Ottawa (10.0%, a difference of 0.22%), and Alaskan Athabascan (10.1%, a difference of 0.41%).
| Demographics | Rating | Rank | Family Poverty |
| Immigrants | Cambodia | 4.8 /100 | #221 | Tragic 9.9% |
| Japanese | 4.8 /100 | #222 | Tragic 9.9% |
| Immigrants | Africa | 4.3 /100 | #223 | Tragic 9.9% |
| Marshallese | 3.9 /100 | #224 | Tragic 9.9% |
| Immigrants | Immigrants | 3.6 /100 | #225 | Tragic 10.0% |
| Ottawa | 3.3 /100 | #226 | Tragic 10.0% |
| Immigrants | Armenia | 3.3 /100 | #227 | Tragic 10.0% |
| Sudanese | 3.1 /100 | #228 | Tragic 10.0% |
| Immigrants | Uzbekistan | 3.1 /100 | #229 | Tragic 10.0% |
| Immigrants | Panama | 3.1 /100 | #230 | Tragic 10.0% |
| Alaskan Athabascans | 2.7 /100 | #231 | Tragic 10.1% |
| Immigrants | Sudan | 2.3 /100 | #232 | Tragic 10.1% |
| Fijians | 2.1 /100 | #233 | Tragic 10.1% |
| Immigrants | Middle Africa | 2.1 /100 | #234 | Tragic 10.1% |
| Nigerians | 2.0 /100 | #235 | Tragic 10.1% |
Demographics Similar to Immigrants from Ecuador by Family Poverty
In terms of family poverty, the demographic groups most similar to Immigrants from Ecuador are Immigrants from Nicaragua (11.1%, a difference of 0.010%), Immigrants from Bahamas (11.1%, a difference of 0.25%), Immigrants from Jamaica (11.2%, a difference of 0.35%), Jamaican (11.1%, a difference of 0.48%), and Comanche (11.0%, a difference of 0.58%).
| Demographics | Rating | Rank | Family Poverty |
| Spanish American Indians | 0.2 /100 | #262 | Tragic 10.9% |
| Cape Verdeans | 0.1 /100 | #263 | Tragic 10.9% |
| Trinidadians and Tobagonians | 0.1 /100 | #264 | Tragic 10.9% |
| Immigrants | Trinidad and Tobago | 0.1 /100 | #265 | Tragic 10.9% |
| Immigrants | El Salvador | 0.1 /100 | #266 | Tragic 11.0% |
| Comanche | 0.1 /100 | #267 | Tragic 11.0% |
| Jamaicans | 0.1 /100 | #268 | Tragic 11.1% |
| Immigrants | Ecuador | 0.1 /100 | #269 | Tragic 11.1% |
| Immigrants | Nicaragua | 0.1 /100 | #270 | Tragic 11.1% |
| Immigrants | Bahamas | 0.1 /100 | #271 | Tragic 11.1% |
| Immigrants | Jamaica | 0.1 /100 | #272 | Tragic 11.2% |
| Somalis | 0.1 /100 | #273 | Tragic 11.2% |
| Spanish Americans | 0.1 /100 | #274 | Tragic 11.2% |
| Central Americans | 0.1 /100 | #275 | Tragic 11.2% |
| Immigrants | Guyana | 0.1 /100 | #276 | Tragic 11.2% |