Basque vs Immigrants from Belize Family Poverty
COMPARE
Basque
Immigrants from Belize
Family Poverty
Family Poverty Comparison
Basques
Immigrants from Belize
8.1%
FAMILY POVERTY
94.9/ 100
METRIC RATING
108th/ 347
METRIC RANK
11.5%
FAMILY POVERTY
0.0/ 100
METRIC RATING
288th/ 347
METRIC RANK
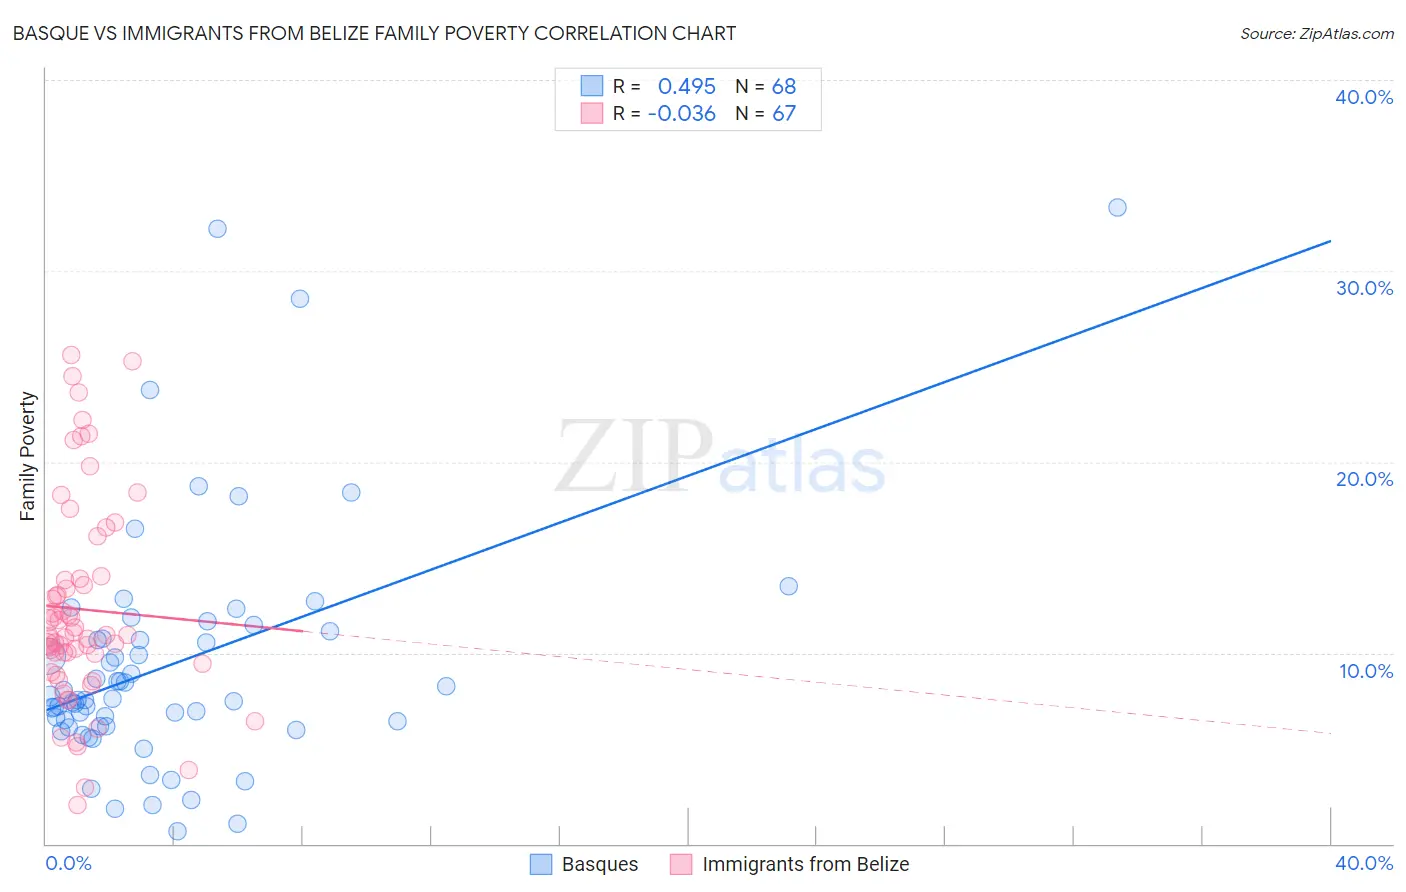
Basque vs Immigrants from Belize Family Poverty Correlation Chart
The statistical analysis conducted on geographies consisting of 165,603,932 people shows a moderate positive correlation between the proportion of Basques and poverty level among families in the United States with a correlation coefficient (R) of 0.495 and weighted average of 8.1%. Similarly, the statistical analysis conducted on geographies consisting of 130,249,442 people shows no correlation between the proportion of Immigrants from Belize and poverty level among families in the United States with a correlation coefficient (R) of -0.036 and weighted average of 11.5%, a difference of 41.4%.
Family Poverty Correlation Summary
| Measurement | Basque | Immigrants from Belize |
| Minimum | 0.66% | 2.0% |
| Maximum | 33.3% | 25.6% |
| Range | 32.7% | 23.6% |
| Mean | 9.4% | 12.3% |
| Median | 7.6% | 10.9% |
| Interquartile 25% (IQ1) | 6.2% | 9.4% |
| Interquartile 75% (IQ3) | 10.9% | 13.8% |
| Interquartile Range (IQR) | 4.8% | 4.4% |
| Standard Deviation (Sample) | 6.4% | 5.3% |
| Standard Deviation (Population) | 6.3% | 5.3% |
Similar Demographics by Family Poverty
Demographics Similar to Basques by Family Poverty
In terms of family poverty, the demographic groups most similar to Basques are French Canadian (8.1%, a difference of 0.090%), Jordanian (8.2%, a difference of 0.090%), Egyptian (8.1%, a difference of 0.13%), Romanian (8.2%, a difference of 0.18%), and Taiwanese (8.2%, a difference of 0.23%).
| Demographics | Rating | Rank | Family Poverty |
| Immigrants | Norway | 95.7 /100 | #101 | Exceptional 8.1% |
| Immigrants | Indonesia | 95.7 /100 | #102 | Exceptional 8.1% |
| Immigrants | Eastern Europe | 95.6 /100 | #103 | Exceptional 8.1% |
| Slavs | 95.6 /100 | #104 | Exceptional 8.1% |
| Laotians | 95.6 /100 | #105 | Exceptional 8.1% |
| Egyptians | 95.1 /100 | #106 | Exceptional 8.1% |
| French Canadians | 95.0 /100 | #107 | Exceptional 8.1% |
| Basques | 94.9 /100 | #108 | Exceptional 8.1% |
| Jordanians | 94.8 /100 | #109 | Exceptional 8.2% |
| Romanians | 94.7 /100 | #110 | Exceptional 8.2% |
| Taiwanese | 94.6 /100 | #111 | Exceptional 8.2% |
| Immigrants | France | 94.4 /100 | #112 | Exceptional 8.2% |
| Canadians | 94.2 /100 | #113 | Exceptional 8.2% |
| Immigrants | Zimbabwe | 94.0 /100 | #114 | Exceptional 8.2% |
| Immigrants | Israel | 93.5 /100 | #115 | Exceptional 8.2% |
Demographics Similar to Immigrants from Belize by Family Poverty
In terms of family poverty, the demographic groups most similar to Immigrants from Belize are Immigrants from Barbados (11.5%, a difference of 0.050%), West Indian (11.5%, a difference of 0.060%), Haitian (11.5%, a difference of 0.12%), Vietnamese (11.5%, a difference of 0.19%), and Immigrants from Somalia (11.5%, a difference of 0.22%).
| Demographics | Rating | Rank | Family Poverty |
| Immigrants | West Indies | 0.0 /100 | #281 | Tragic 11.3% |
| Immigrants | Cuba | 0.0 /100 | #282 | Tragic 11.3% |
| Indonesians | 0.0 /100 | #283 | Tragic 11.3% |
| Yaqui | 0.0 /100 | #284 | Tragic 11.3% |
| Barbadians | 0.0 /100 | #285 | Tragic 11.3% |
| Senegalese | 0.0 /100 | #286 | Tragic 11.5% |
| Vietnamese | 0.0 /100 | #287 | Tragic 11.5% |
| Immigrants | Belize | 0.0 /100 | #288 | Tragic 11.5% |
| Immigrants | Barbados | 0.0 /100 | #289 | Tragic 11.5% |
| West Indians | 0.0 /100 | #290 | Tragic 11.5% |
| Haitians | 0.0 /100 | #291 | Tragic 11.5% |
| Immigrants | Somalia | 0.0 /100 | #292 | Tragic 11.5% |
| Immigrants | Cabo Verde | 0.0 /100 | #293 | Tragic 11.6% |
| Immigrants | St. Vincent and the Grenadines | 0.0 /100 | #294 | Tragic 11.6% |
| Immigrants | Haiti | 0.0 /100 | #295 | Tragic 11.6% |