Immigrants from Thailand vs Immigrants from Belize Family Poverty
COMPARE
Immigrants from Thailand
Immigrants from Belize
Family Poverty
Family Poverty Comparison
Immigrants from Thailand
Immigrants from Belize
9.7%
FAMILY POVERTY
9.7/ 100
METRIC RATING
212th/ 347
METRIC RANK
11.5%
FAMILY POVERTY
0.0/ 100
METRIC RATING
288th/ 347
METRIC RANK
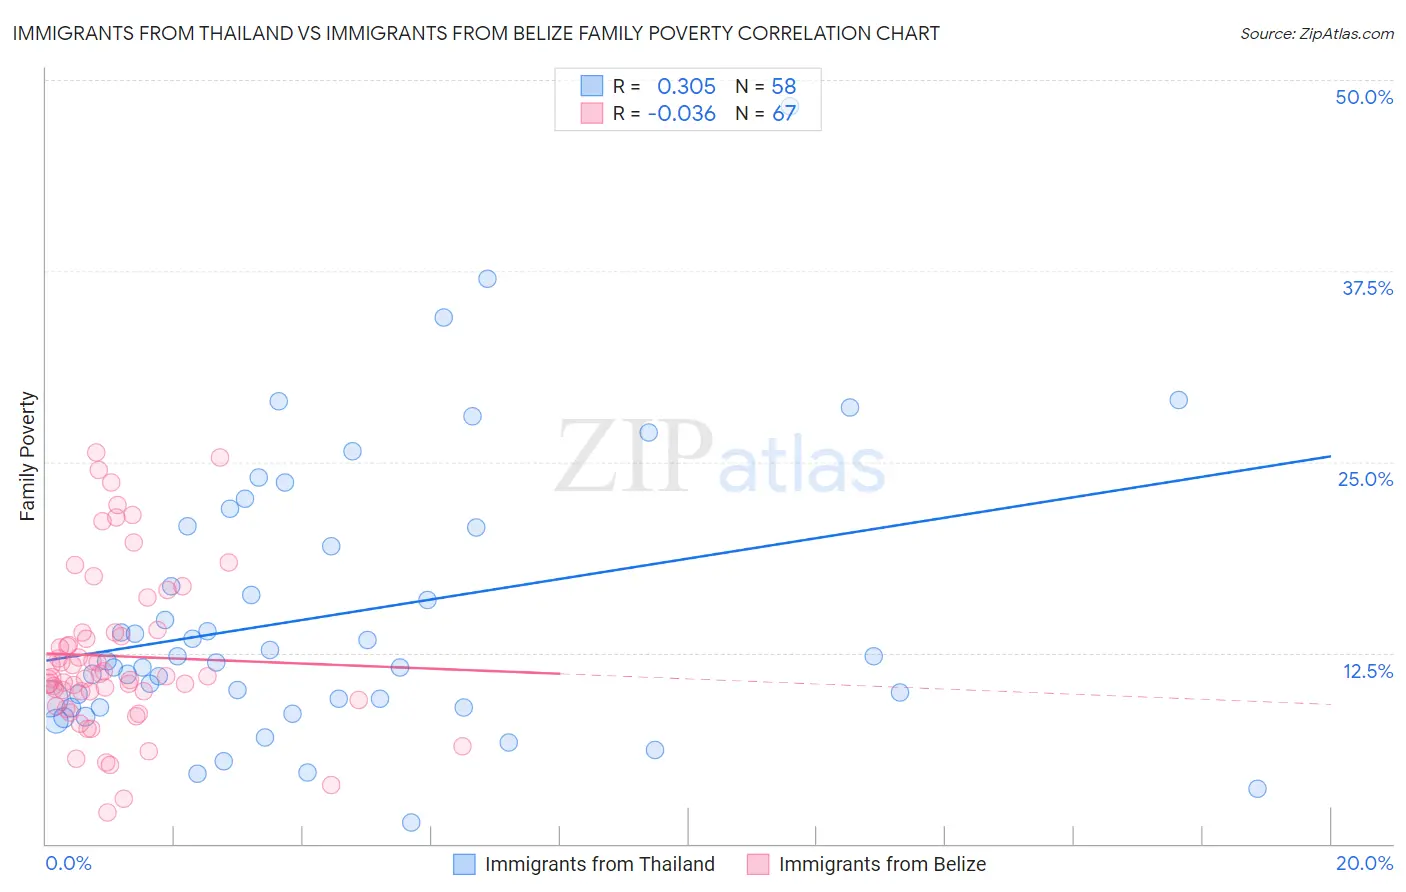
Immigrants from Thailand vs Immigrants from Belize Family Poverty Correlation Chart
The statistical analysis conducted on geographies consisting of 316,654,872 people shows a mild positive correlation between the proportion of Immigrants from Thailand and poverty level among families in the United States with a correlation coefficient (R) of 0.305 and weighted average of 9.7%. Similarly, the statistical analysis conducted on geographies consisting of 130,249,442 people shows no correlation between the proportion of Immigrants from Belize and poverty level among families in the United States with a correlation coefficient (R) of -0.036 and weighted average of 11.5%, a difference of 19.2%.
Family Poverty Correlation Summary
| Measurement | Immigrants from Thailand | Immigrants from Belize |
| Minimum | 1.4% | 2.0% |
| Maximum | 48.3% | 25.6% |
| Range | 46.9% | 23.6% |
| Mean | 15.0% | 12.3% |
| Median | 11.9% | 10.9% |
| Interquartile 25% (IQ1) | 8.9% | 9.4% |
| Interquartile 75% (IQ3) | 20.7% | 13.8% |
| Interquartile Range (IQR) | 11.8% | 4.4% |
| Standard Deviation (Sample) | 9.2% | 5.3% |
| Standard Deviation (Population) | 9.1% | 5.3% |
Similar Demographics by Family Poverty
Demographics Similar to Immigrants from Thailand by Family Poverty
In terms of family poverty, the demographic groups most similar to Immigrants from Thailand are Malaysian (9.6%, a difference of 0.30%), Alsatian (9.6%, a difference of 0.54%), Osage (9.7%, a difference of 0.63%), Immigrants from Micronesia (9.8%, a difference of 1.2%), and Nonimmigrants (9.8%, a difference of 1.2%).
| Demographics | Rating | Rank | Family Poverty |
| Aleuts | 18.0 /100 | #205 | Poor 9.5% |
| Immigrants | South America | 18.0 /100 | #206 | Poor 9.5% |
| Sierra Leoneans | 15.6 /100 | #207 | Poor 9.5% |
| Immigrants | Eastern Africa | 15.1 /100 | #208 | Poor 9.5% |
| Immigrants | Uruguay | 14.0 /100 | #209 | Poor 9.5% |
| Alsatians | 11.3 /100 | #210 | Poor 9.6% |
| Malaysians | 10.6 /100 | #211 | Poor 9.6% |
| Immigrants | Thailand | 9.7 /100 | #212 | Tragic 9.7% |
| Osage | 8.0 /100 | #213 | Tragic 9.7% |
| Immigrants | Micronesia | 6.7 /100 | #214 | Tragic 9.8% |
| Immigrants | Nonimmigrants | 6.7 /100 | #215 | Tragic 9.8% |
| Moroccans | 6.5 /100 | #216 | Tragic 9.8% |
| Americans | 6.2 /100 | #217 | Tragic 9.8% |
| Panamanians | 5.6 /100 | #218 | Tragic 9.8% |
| Immigrants | Eritrea | 5.4 /100 | #219 | Tragic 9.9% |
Demographics Similar to Immigrants from Belize by Family Poverty
In terms of family poverty, the demographic groups most similar to Immigrants from Belize are Immigrants from Barbados (11.5%, a difference of 0.050%), West Indian (11.5%, a difference of 0.060%), Haitian (11.5%, a difference of 0.12%), Vietnamese (11.5%, a difference of 0.19%), and Immigrants from Somalia (11.5%, a difference of 0.22%).
| Demographics | Rating | Rank | Family Poverty |
| Immigrants | West Indies | 0.0 /100 | #281 | Tragic 11.3% |
| Immigrants | Cuba | 0.0 /100 | #282 | Tragic 11.3% |
| Indonesians | 0.0 /100 | #283 | Tragic 11.3% |
| Yaqui | 0.0 /100 | #284 | Tragic 11.3% |
| Barbadians | 0.0 /100 | #285 | Tragic 11.3% |
| Senegalese | 0.0 /100 | #286 | Tragic 11.5% |
| Vietnamese | 0.0 /100 | #287 | Tragic 11.5% |
| Immigrants | Belize | 0.0 /100 | #288 | Tragic 11.5% |
| Immigrants | Barbados | 0.0 /100 | #289 | Tragic 11.5% |
| West Indians | 0.0 /100 | #290 | Tragic 11.5% |
| Haitians | 0.0 /100 | #291 | Tragic 11.5% |
| Immigrants | Somalia | 0.0 /100 | #292 | Tragic 11.5% |
| Immigrants | Cabo Verde | 0.0 /100 | #293 | Tragic 11.6% |
| Immigrants | St. Vincent and the Grenadines | 0.0 /100 | #294 | Tragic 11.6% |
| Immigrants | Haiti | 0.0 /100 | #295 | Tragic 11.6% |