Celtic vs Asian Per Capita Income
COMPARE
Celtic
Asian
Per Capita Income
Per Capita Income Comparison
Celtics
Asians
$43,621
PER CAPITA INCOME
48.9/ 100
METRIC RATING
175th/ 347
METRIC RANK
$50,057
PER CAPITA INCOME
99.9/ 100
METRIC RATING
56th/ 347
METRIC RANK
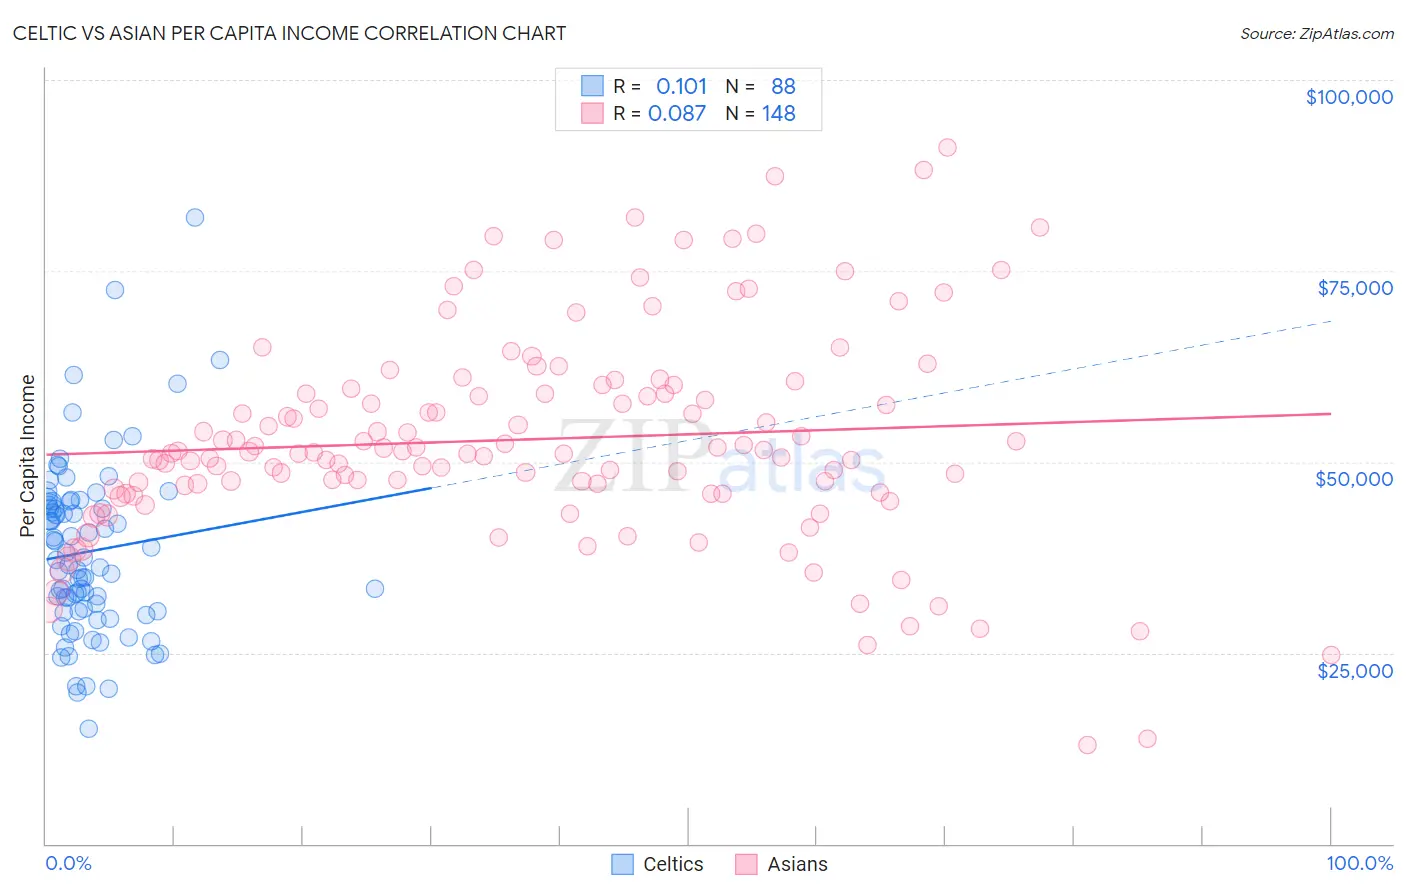
Celtic vs Asian Per Capita Income Correlation Chart
The statistical analysis conducted on geographies consisting of 168,877,272 people shows a poor positive correlation between the proportion of Celtics and per capita income in the United States with a correlation coefficient (R) of 0.101 and weighted average of $43,621. Similarly, the statistical analysis conducted on geographies consisting of 550,984,990 people shows a slight positive correlation between the proportion of Asians and per capita income in the United States with a correlation coefficient (R) of 0.087 and weighted average of $50,057, a difference of 14.7%.
Per Capita Income Correlation Summary
| Measurement | Celtic | Asian |
| Minimum | $15,033 | $12,941 |
| Maximum | $81,943 | $91,125 |
| Range | $66,910 | $78,184 |
| Mean | $38,287 | $52,955 |
| Median | $36,864 | $51,252 |
| Interquartile 25% (IQ1) | $30,511 | $46,204 |
| Interquartile 75% (IQ3) | $44,540 | $59,246 |
| Interquartile Range (IQR) | $14,029 | $13,041 |
| Standard Deviation (Sample) | $11,448 | $13,804 |
| Standard Deviation (Population) | $11,383 | $13,757 |
Similar Demographics by Per Capita Income
Demographics Similar to Celtics by Per Capita Income
In terms of per capita income, the demographic groups most similar to Celtics are Colombian ($43,661, a difference of 0.090%), French ($43,685, a difference of 0.15%), Immigrants from South Eastern Asia ($43,539, a difference of 0.19%), Tlingit-Haida ($43,516, a difference of 0.24%), and Immigrants from Costa Rica ($43,464, a difference of 0.36%).
| Demographics | Rating | Rank | Per Capita Income |
| Belgians | 58.1 /100 | #168 | Average $43,951 |
| Immigrants | Peru | 55.3 /100 | #169 | Average $43,852 |
| Scandinavians | 55.2 /100 | #170 | Average $43,848 |
| Immigrants | Eastern Africa | 54.9 /100 | #171 | Average $43,838 |
| Czechoslovakians | 54.1 /100 | #172 | Average $43,806 |
| French | 50.7 /100 | #173 | Average $43,685 |
| Colombians | 50.0 /100 | #174 | Average $43,661 |
| Celtics | 48.9 /100 | #175 | Average $43,621 |
| Immigrants | South Eastern Asia | 46.6 /100 | #176 | Average $43,539 |
| Tlingit-Haida | 45.9 /100 | #177 | Average $43,516 |
| Immigrants | Costa Rica | 44.5 /100 | #178 | Average $43,464 |
| Finns | 44.4 /100 | #179 | Average $43,461 |
| Sierra Leoneans | 42.9 /100 | #180 | Average $43,405 |
| Welsh | 38.2 /100 | #181 | Fair $43,233 |
| Immigrants | Vietnam | 38.1 /100 | #182 | Fair $43,229 |
Demographics Similar to Asians by Per Capita Income
In terms of per capita income, the demographic groups most similar to Asians are Immigrants from Western Europe ($50,065, a difference of 0.020%), South African ($50,044, a difference of 0.030%), Immigrants from Malaysia ($49,983, a difference of 0.15%), Bhutanese ($49,894, a difference of 0.33%), and Immigrants from Scotland ($49,893, a difference of 0.33%).
| Demographics | Rating | Rank | Per Capita Income |
| New Zealanders | 100.0 /100 | #49 | Exceptional $50,575 |
| Immigrants | Sri Lanka | 100.0 /100 | #50 | Exceptional $50,555 |
| Immigrants | Netherlands | 100.0 /100 | #51 | Exceptional $50,458 |
| Immigrants | Croatia | 99.9 /100 | #52 | Exceptional $50,417 |
| Paraguayans | 99.9 /100 | #53 | Exceptional $50,385 |
| Immigrants | Belarus | 99.9 /100 | #54 | Exceptional $50,303 |
| Immigrants | Western Europe | 99.9 /100 | #55 | Exceptional $50,065 |
| Asians | 99.9 /100 | #56 | Exceptional $50,057 |
| South Africans | 99.9 /100 | #57 | Exceptional $50,044 |
| Immigrants | Malaysia | 99.9 /100 | #58 | Exceptional $49,983 |
| Bhutanese | 99.9 /100 | #59 | Exceptional $49,894 |
| Immigrants | Scotland | 99.9 /100 | #60 | Exceptional $49,893 |
| Argentineans | 99.9 /100 | #61 | Exceptional $49,862 |
| Immigrants | Asia | 99.9 /100 | #62 | Exceptional $49,741 |
| Maltese | 99.9 /100 | #63 | Exceptional $49,640 |