Celtic vs Asian 9th Grade
COMPARE
Celtic
Asian
9th Grade
9th Grade Comparison
Celtics
Asians
96.0%
9TH GRADE
99.9/ 100
METRIC RATING
50th/ 347
METRIC RANK
94.5%
9TH GRADE
9.9/ 100
METRIC RATING
217th/ 347
METRIC RANK
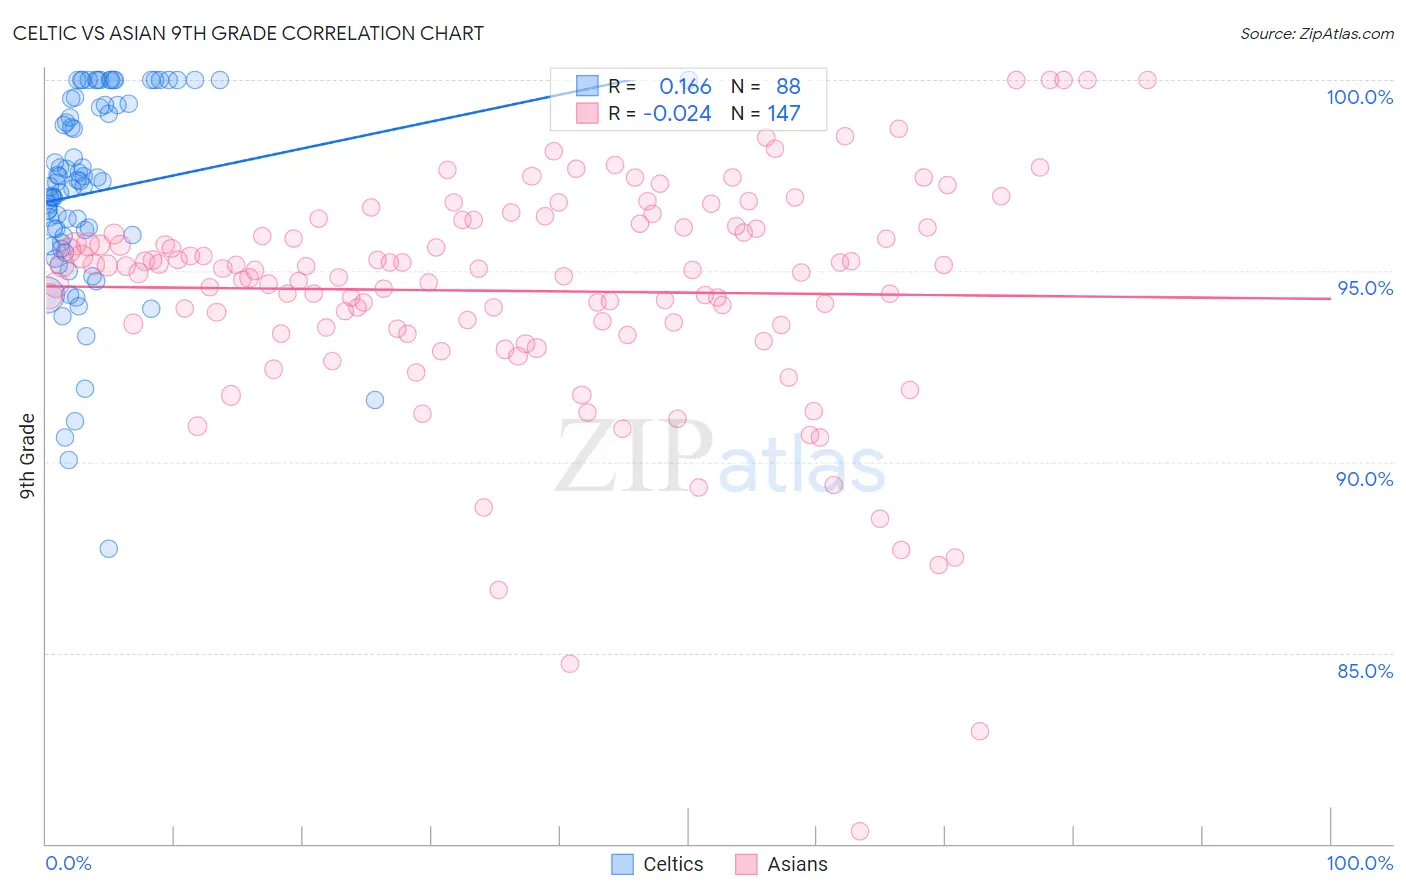
Celtic vs Asian 9th Grade Correlation Chart
The statistical analysis conducted on geographies consisting of 168,876,981 people shows a poor positive correlation between the proportion of Celtics and percentage of population with at least 9th grade education in the United States with a correlation coefficient (R) of 0.166 and weighted average of 96.0%. Similarly, the statistical analysis conducted on geographies consisting of 550,857,622 people shows no correlation between the proportion of Asians and percentage of population with at least 9th grade education in the United States with a correlation coefficient (R) of -0.024 and weighted average of 94.5%, a difference of 1.6%.
9th Grade Correlation Summary
| Measurement | Celtic | Asian |
| Minimum | 87.7% | 80.3% |
| Maximum | 100.0% | 100.0% |
| Range | 12.3% | 19.7% |
| Mean | 97.1% | 94.5% |
| Median | 97.3% | 95.0% |
| Interquartile 25% (IQ1) | 95.8% | 93.5% |
| Interquartile 75% (IQ3) | 99.4% | 96.2% |
| Interquartile Range (IQR) | 3.5% | 2.6% |
| Standard Deviation (Sample) | 2.6% | 3.0% |
| Standard Deviation (Population) | 2.6% | 3.0% |
Similar Demographics by 9th Grade
Demographics Similar to Celtics by 9th Grade
In terms of 9th grade, the demographic groups most similar to Celtics are Greek (96.0%, a difference of 0.010%), Immigrants from Northern Europe (96.0%, a difference of 0.010%), Russian (96.0%, a difference of 0.020%), Australian (96.0%, a difference of 0.020%), and Serbian (96.0%, a difference of 0.020%).
| Demographics | Rating | Rank | 9th Grade |
| Iranians | 99.9 /100 | #43 | Exceptional 96.1% |
| Alaska Natives | 99.9 /100 | #44 | Exceptional 96.1% |
| Crow | 99.9 /100 | #45 | Exceptional 96.1% |
| Immigrants | India | 99.9 /100 | #46 | Exceptional 96.1% |
| Russians | 99.9 /100 | #47 | Exceptional 96.0% |
| Australians | 99.9 /100 | #48 | Exceptional 96.0% |
| Greeks | 99.9 /100 | #49 | Exceptional 96.0% |
| Celtics | 99.9 /100 | #50 | Exceptional 96.0% |
| Immigrants | Northern Europe | 99.9 /100 | #51 | Exceptional 96.0% |
| Serbians | 99.9 /100 | #52 | Exceptional 96.0% |
| Austrians | 99.8 /100 | #53 | Exceptional 96.0% |
| Immigrants | Canada | 99.8 /100 | #54 | Exceptional 96.0% |
| Immigrants | Austria | 99.8 /100 | #55 | Exceptional 96.0% |
| Immigrants | North America | 99.8 /100 | #56 | Exceptional 96.0% |
| Macedonians | 99.8 /100 | #57 | Exceptional 96.0% |
Demographics Similar to Asians by 9th Grade
In terms of 9th grade, the demographic groups most similar to Asians are Portuguese (94.5%, a difference of 0.010%), Immigrants from Syria (94.5%, a difference of 0.020%), Immigrants from Western Asia (94.5%, a difference of 0.020%), African (94.5%, a difference of 0.020%), and Indian (Asian) (94.5%, a difference of 0.030%).
| Demographics | Rating | Rank | 9th Grade |
| Immigrants | Chile | 13.4 /100 | #210 | Poor 94.5% |
| Immigrants | Indonesia | 12.3 /100 | #211 | Poor 94.5% |
| Immigrants | Malaysia | 12.2 /100 | #212 | Poor 94.5% |
| Immigrants | Oceania | 12.1 /100 | #213 | Poor 94.5% |
| Immigrants | Liberia | 11.8 /100 | #214 | Poor 94.5% |
| Immigrants | Syria | 11.0 /100 | #215 | Poor 94.5% |
| Immigrants | Western Asia | 10.7 /100 | #216 | Poor 94.5% |
| Asians | 9.9 /100 | #217 | Tragic 94.5% |
| Portuguese | 9.2 /100 | #218 | Tragic 94.5% |
| Africans | 9.0 /100 | #219 | Tragic 94.5% |
| Indians (Asian) | 8.6 /100 | #220 | Tragic 94.5% |
| Immigrants | Eastern Africa | 8.2 /100 | #221 | Tragic 94.5% |
| Immigrants | Asia | 7.7 /100 | #222 | Tragic 94.4% |
| Bahamians | 7.0 /100 | #223 | Tragic 94.4% |
| Tongans | 6.0 /100 | #224 | Tragic 94.4% |