Celtic vs Houma Poverty
COMPARE
Celtic
Houma
Poverty
Poverty Comparison
Celtics
Houma
12.3%
POVERTY
50.1/ 100
METRIC RATING
173rd/ 347
METRIC RANK
18.4%
POVERTY
0.0/ 100
METRIC RATING
333rd/ 347
METRIC RANK
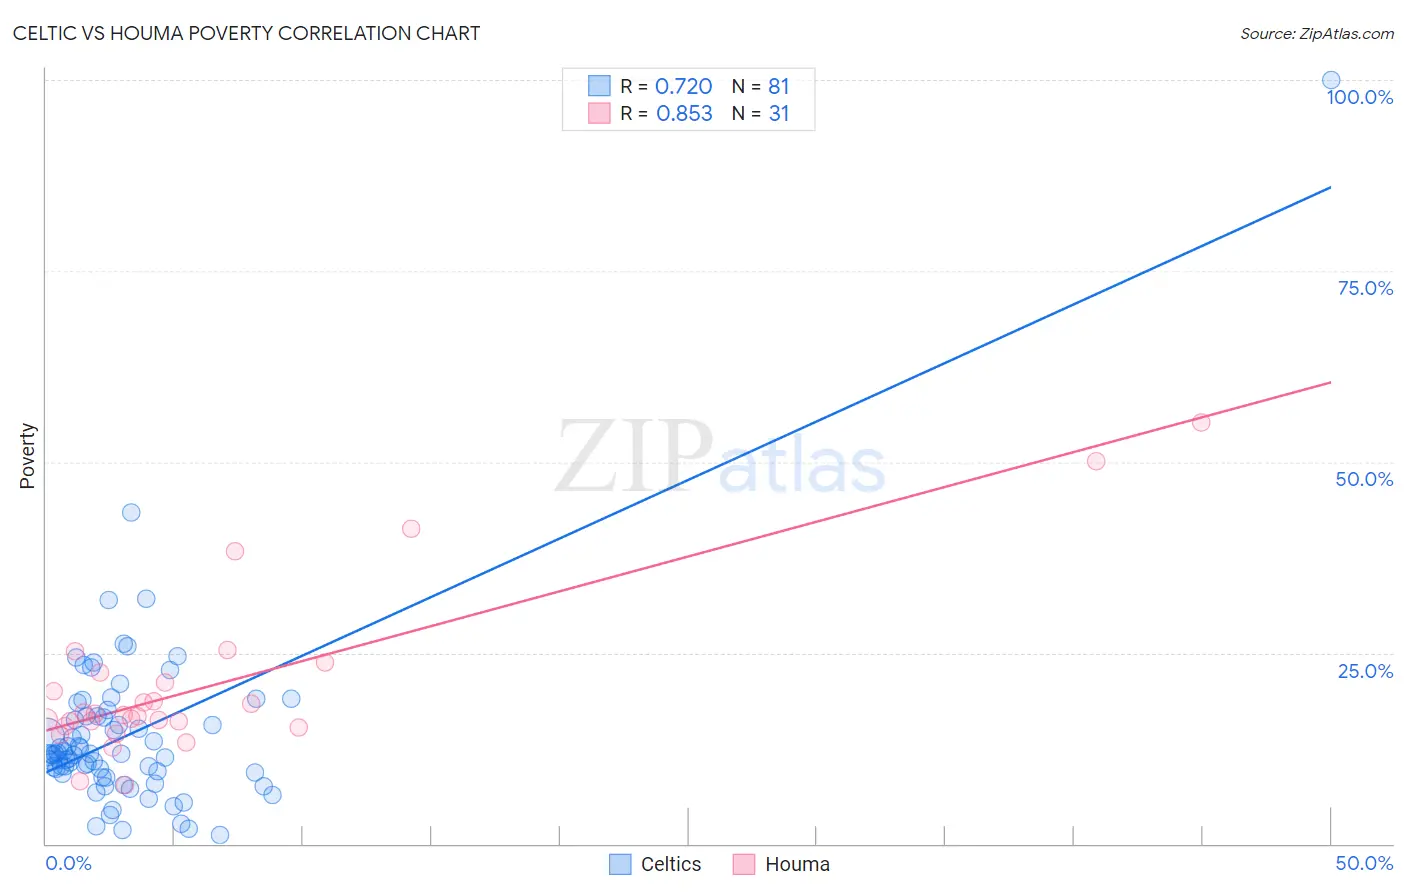
Celtic vs Houma Poverty Correlation Chart
The statistical analysis conducted on geographies consisting of 168,858,616 people shows a strong positive correlation between the proportion of Celtics and poverty level in the United States with a correlation coefficient (R) of 0.720 and weighted average of 12.3%. Similarly, the statistical analysis conducted on geographies consisting of 36,796,778 people shows a very strong positive correlation between the proportion of Houma and poverty level in the United States with a correlation coefficient (R) of 0.853 and weighted average of 18.4%, a difference of 49.6%.
Poverty Correlation Summary
| Measurement | Celtic | Houma |
| Minimum | 1.1% | 7.7% |
| Maximum | 100.0% | 55.1% |
| Range | 98.9% | 47.4% |
| Mean | 14.3% | 20.8% |
| Median | 11.7% | 16.9% |
| Interquartile 25% (IQ1) | 9.3% | 15.3% |
| Interquartile 75% (IQ3) | 16.7% | 22.4% |
| Interquartile Range (IQR) | 7.4% | 7.1% |
| Standard Deviation (Sample) | 12.1% | 11.0% |
| Standard Deviation (Population) | 12.1% | 10.8% |
Similar Demographics by Poverty
Demographics Similar to Celtics by Poverty
In terms of poverty, the demographic groups most similar to Celtics are Lebanese (12.3%, a difference of 0.010%), Immigrants from Portugal (12.3%, a difference of 0.040%), Immigrants from Spain (12.3%, a difference of 0.11%), South American (12.3%, a difference of 0.14%), and Immigrants from Colombia (12.3%, a difference of 0.24%).
| Demographics | Rating | Rank | Poverty |
| Venezuelans | 56.9 /100 | #166 | Average 12.2% |
| Immigrants | Chile | 56.7 /100 | #167 | Average 12.2% |
| Immigrants | Venezuela | 56.5 /100 | #168 | Average 12.2% |
| Whites/Caucasians | 55.4 /100 | #169 | Average 12.3% |
| Immigrants | Oceania | 54.6 /100 | #170 | Average 12.3% |
| Immigrants | Spain | 51.3 /100 | #171 | Average 12.3% |
| Immigrants | Portugal | 50.5 /100 | #172 | Average 12.3% |
| Celtics | 50.1 /100 | #173 | Average 12.3% |
| Lebanese | 50.0 /100 | #174 | Average 12.3% |
| South Americans | 48.7 /100 | #175 | Average 12.3% |
| Immigrants | Colombia | 47.7 /100 | #176 | Average 12.3% |
| Immigrants | Syria | 47.5 /100 | #177 | Average 12.3% |
| Uruguayans | 44.7 /100 | #178 | Average 12.4% |
| Immigrants | Morocco | 44.0 /100 | #179 | Average 12.4% |
| Mongolians | 43.6 /100 | #180 | Average 12.4% |
Demographics Similar to Houma by Poverty
In terms of poverty, the demographic groups most similar to Houma are Apache (18.4%, a difference of 0.0%), Native/Alaskan (18.1%, a difference of 2.0%), Cheyenne (18.9%, a difference of 2.8%), Immigrants from Dominican Republic (17.8%, a difference of 3.5%), and Dominican (17.6%, a difference of 4.4%).
| Demographics | Rating | Rank | Poverty |
| Paiute | 0.0 /100 | #326 | Tragic 16.7% |
| Kiowa | 0.0 /100 | #327 | Tragic 16.8% |
| Ute | 0.0 /100 | #328 | Tragic 16.9% |
| Blacks/African Americans | 0.0 /100 | #329 | Tragic 17.3% |
| Dominicans | 0.0 /100 | #330 | Tragic 17.6% |
| Immigrants | Dominican Republic | 0.0 /100 | #331 | Tragic 17.8% |
| Natives/Alaskans | 0.0 /100 | #332 | Tragic 18.1% |
| Houma | 0.0 /100 | #333 | Tragic 18.4% |
| Apache | 0.0 /100 | #334 | Tragic 18.4% |
| Cheyenne | 0.0 /100 | #335 | Tragic 18.9% |
| Pueblo | 0.0 /100 | #336 | Tragic 19.4% |
| Sioux | 0.0 /100 | #337 | Tragic 19.8% |
| Yuman | 0.0 /100 | #338 | Tragic 20.2% |
| Crow | 0.0 /100 | #339 | Tragic 20.7% |
| Yup'ik | 0.0 /100 | #340 | Tragic 20.8% |