Cape Verdean vs Hawaiian Householder Income Ages 45 - 64 years
COMPARE
Cape Verdean
Hawaiian
Householder Income Ages 45 - 64 years
Householder Income Ages 45 - 64 years Comparison
Cape Verdeans
Hawaiians
$87,580
HOUSEHOLDER INCOME AGES 45 - 64 YEARS
0.2/ 100
METRIC RATING
272nd/ 347
METRIC RANK
$98,778
HOUSEHOLDER INCOME AGES 45 - 64 YEARS
31.6/ 100
METRIC RATING
193rd/ 347
METRIC RANK
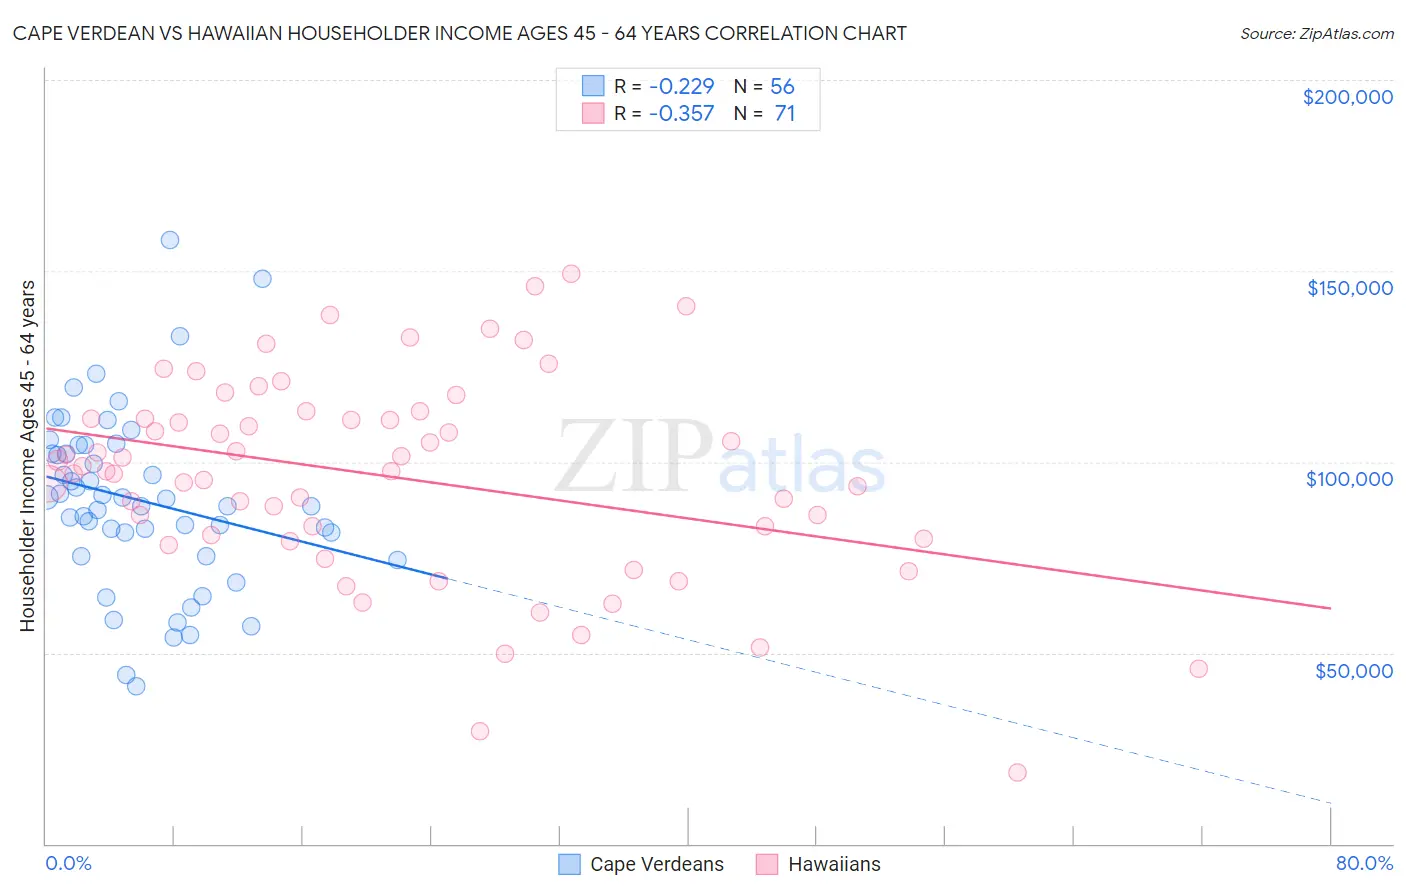
Cape Verdean vs Hawaiian Householder Income Ages 45 - 64 years Correlation Chart
The statistical analysis conducted on geographies consisting of 107,500,216 people shows a weak negative correlation between the proportion of Cape Verdeans and household income with householder between the ages 45 and 64 in the United States with a correlation coefficient (R) of -0.229 and weighted average of $87,580. Similarly, the statistical analysis conducted on geographies consisting of 327,005,411 people shows a mild negative correlation between the proportion of Hawaiians and household income with householder between the ages 45 and 64 in the United States with a correlation coefficient (R) of -0.357 and weighted average of $98,778, a difference of 12.8%.
Householder Income Ages 45 - 64 years Correlation Summary
| Measurement | Cape Verdean | Hawaiian |
| Minimum | $41,310 | $18,640 |
| Maximum | $158,026 | $149,180 |
| Range | $116,716 | $130,540 |
| Mean | $89,896 | $96,039 |
| Median | $89,458 | $97,593 |
| Interquartile 25% (IQ1) | $78,368 | $79,762 |
| Interquartile 75% (IQ3) | $103,256 | $111,438 |
| Interquartile Range (IQR) | $24,888 | $31,676 |
| Standard Deviation (Sample) | $23,178 | $26,677 |
| Standard Deviation (Population) | $22,970 | $26,488 |
Similar Demographics by Householder Income Ages 45 - 64 years
Demographics Similar to Cape Verdeans by Householder Income Ages 45 - 64 years
In terms of householder income ages 45 - 64 years, the demographic groups most similar to Cape Verdeans are Spanish American Indian ($87,561, a difference of 0.020%), Guatemalan ($87,705, a difference of 0.14%), Immigrants from Liberia ($87,739, a difference of 0.18%), Spanish American ($87,836, a difference of 0.29%), and Immigrants from Micronesia ($87,864, a difference of 0.32%).
| Demographics | Rating | Rank | Householder Income Ages 45 - 64 years |
| Jamaicans | 0.2 /100 | #265 | Tragic $88,327 |
| Immigrants | West Indies | 0.2 /100 | #266 | Tragic $88,164 |
| Hmong | 0.2 /100 | #267 | Tragic $88,115 |
| Immigrants | Micronesia | 0.2 /100 | #268 | Tragic $87,864 |
| Spanish Americans | 0.2 /100 | #269 | Tragic $87,836 |
| Immigrants | Liberia | 0.2 /100 | #270 | Tragic $87,739 |
| Guatemalans | 0.2 /100 | #271 | Tragic $87,705 |
| Cape Verdeans | 0.2 /100 | #272 | Tragic $87,580 |
| Spanish American Indians | 0.2 /100 | #273 | Tragic $87,561 |
| Iroquois | 0.1 /100 | #274 | Tragic $87,255 |
| Immigrants | Belize | 0.1 /100 | #275 | Tragic $87,229 |
| Immigrants | Latin America | 0.1 /100 | #276 | Tragic $87,219 |
| Cree | 0.1 /100 | #277 | Tragic $87,185 |
| Immigrants | Jamaica | 0.1 /100 | #278 | Tragic $87,035 |
| Yakama | 0.1 /100 | #279 | Tragic $86,992 |
Demographics Similar to Hawaiians by Householder Income Ages 45 - 64 years
In terms of householder income ages 45 - 64 years, the demographic groups most similar to Hawaiians are Celtic ($98,896, a difference of 0.12%), Uruguayan ($98,660, a difference of 0.12%), Kenyan ($98,970, a difference of 0.19%), Spanish ($98,554, a difference of 0.23%), and French Canadian ($99,093, a difference of 0.32%).
| Demographics | Rating | Rank | Householder Income Ages 45 - 64 years |
| Dutch | 41.7 /100 | #186 | Average $99,650 |
| Iraqis | 38.5 /100 | #187 | Fair $99,387 |
| Immigrants | Portugal | 36.3 /100 | #188 | Fair $99,203 |
| Immigrants | South America | 35.4 /100 | #189 | Fair $99,126 |
| French Canadians | 35.1 /100 | #190 | Fair $99,093 |
| Kenyans | 33.7 /100 | #191 | Fair $98,970 |
| Celtics | 32.9 /100 | #192 | Fair $98,896 |
| Hawaiians | 31.6 /100 | #193 | Fair $98,778 |
| Uruguayans | 30.3 /100 | #194 | Fair $98,660 |
| Spanish | 29.2 /100 | #195 | Fair $98,554 |
| Immigrants | Eastern Africa | 28.3 /100 | #196 | Fair $98,467 |
| Puget Sound Salish | 27.0 /100 | #197 | Fair $98,340 |
| Immigrants | Iraq | 25.7 /100 | #198 | Fair $98,201 |
| Whites/Caucasians | 24.6 /100 | #199 | Fair $98,091 |
| Immigrants | Kenya | 23.5 /100 | #200 | Fair $97,964 |