Canadian vs South American Single Male Poverty
COMPARE
Canadian
South American
Single Male Poverty
Single Male Poverty Comparison
Canadians
South Americans
13.3%
SINGLE MALE POVERTY
4.0/ 100
METRIC RATING
234th/ 347
METRIC RANK
12.1%
SINGLE MALE POVERTY
98.5/ 100
METRIC RATING
87th/ 347
METRIC RANK
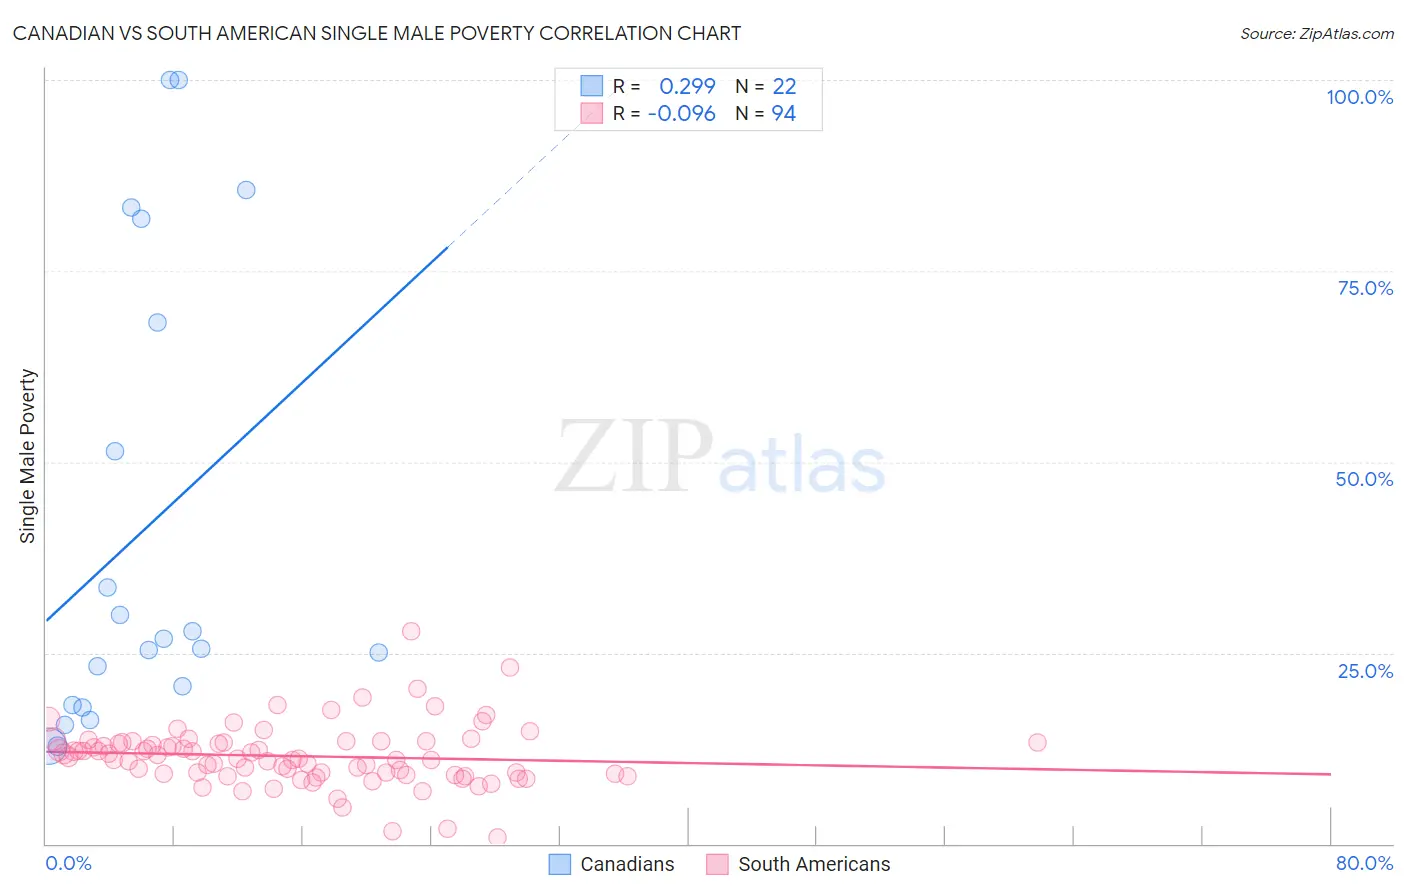
Canadian vs South American Single Male Poverty Correlation Chart
The statistical analysis conducted on geographies consisting of 379,144,992 people shows a weak positive correlation between the proportion of Canadians and poverty level among single males in the United States with a correlation coefficient (R) of 0.299 and weighted average of 13.3%. Similarly, the statistical analysis conducted on geographies consisting of 426,067,746 people shows a slight negative correlation between the proportion of South Americans and poverty level among single males in the United States with a correlation coefficient (R) of -0.096 and weighted average of 12.1%, a difference of 10.2%.
Single Male Poverty Correlation Summary
| Measurement | Canadian | South American |
| Minimum | 12.8% | 0.77% |
| Maximum | 100.0% | 27.8% |
| Range | 87.2% | 27.1% |
| Mean | 41.0% | 11.5% |
| Median | 26.2% | 11.3% |
| Interquartile 25% (IQ1) | 18.1% | 9.1% |
| Interquartile 75% (IQ3) | 68.3% | 13.3% |
| Interquartile Range (IQR) | 50.1% | 4.1% |
| Standard Deviation (Sample) | 30.2% | 4.0% |
| Standard Deviation (Population) | 29.5% | 4.0% |
Similar Demographics by Single Male Poverty
Demographics Similar to Canadians by Single Male Poverty
In terms of single male poverty, the demographic groups most similar to Canadians are British (13.3%, a difference of 0.0%), Bangladeshi (13.3%, a difference of 0.10%), Luxembourger (13.4%, a difference of 0.15%), British West Indian (13.4%, a difference of 0.21%), and Immigrants from Caribbean (13.3%, a difference of 0.29%).
| Demographics | Rating | Rank | Single Male Poverty |
| Haitians | 7.0 /100 | #227 | Tragic 13.2% |
| Lebanese | 6.6 /100 | #228 | Tragic 13.2% |
| Europeans | 6.2 /100 | #229 | Tragic 13.3% |
| Ghanaians | 6.1 /100 | #230 | Tragic 13.3% |
| Slavs | 5.3 /100 | #231 | Tragic 13.3% |
| Immigrants | Caribbean | 5.0 /100 | #232 | Tragic 13.3% |
| British | 4.0 /100 | #233 | Tragic 13.3% |
| Canadians | 4.0 /100 | #234 | Tragic 13.3% |
| Bangladeshis | 3.7 /100 | #235 | Tragic 13.3% |
| Luxembourgers | 3.6 /100 | #236 | Tragic 13.4% |
| British West Indians | 3.4 /100 | #237 | Tragic 13.4% |
| Immigrants | Ghana | 3.2 /100 | #238 | Tragic 13.4% |
| Czechoslovakians | 3.0 /100 | #239 | Tragic 13.4% |
| Belizeans | 2.3 /100 | #240 | Tragic 13.4% |
| Immigrants | Germany | 2.1 /100 | #241 | Tragic 13.4% |
Demographics Similar to South Americans by Single Male Poverty
In terms of single male poverty, the demographic groups most similar to South Americans are Immigrants from Eritrea (12.1%, a difference of 0.0%), Immigrants from Israel (12.1%, a difference of 0.010%), Turkish (12.1%, a difference of 0.030%), Immigrants from Czechoslovakia (12.1%, a difference of 0.11%), and Immigrants from Chile (12.1%, a difference of 0.13%).
| Demographics | Rating | Rank | Single Male Poverty |
| Armenians | 98.7 /100 | #80 | Exceptional 12.1% |
| Immigrants | South America | 98.7 /100 | #81 | Exceptional 12.1% |
| Immigrants | Colombia | 98.6 /100 | #82 | Exceptional 12.1% |
| Immigrants | Chile | 98.6 /100 | #83 | Exceptional 12.1% |
| Immigrants | Czechoslovakia | 98.6 /100 | #84 | Exceptional 12.1% |
| Turks | 98.5 /100 | #85 | Exceptional 12.1% |
| Immigrants | Israel | 98.5 /100 | #86 | Exceptional 12.1% |
| South Americans | 98.5 /100 | #87 | Exceptional 12.1% |
| Immigrants | Eritrea | 98.5 /100 | #88 | Exceptional 12.1% |
| Immigrants | Ireland | 98.3 /100 | #89 | Exceptional 12.1% |
| South American Indians | 98.3 /100 | #90 | Exceptional 12.1% |
| Immigrants | Turkey | 98.2 /100 | #91 | Exceptional 12.1% |
| Spanish American Indians | 98.0 /100 | #92 | Exceptional 12.1% |
| Immigrants | Bosnia and Herzegovina | 97.9 /100 | #93 | Exceptional 12.1% |
| Colombians | 97.8 /100 | #94 | Exceptional 12.2% |