Latvian vs South American Single Male Poverty
COMPARE
Latvian
South American
Single Male Poverty
Single Male Poverty Comparison
Latvians
South Americans
12.7%
SINGLE MALE POVERTY
67.9/ 100
METRIC RATING
157th/ 347
METRIC RANK
12.1%
SINGLE MALE POVERTY
98.5/ 100
METRIC RATING
87th/ 347
METRIC RANK
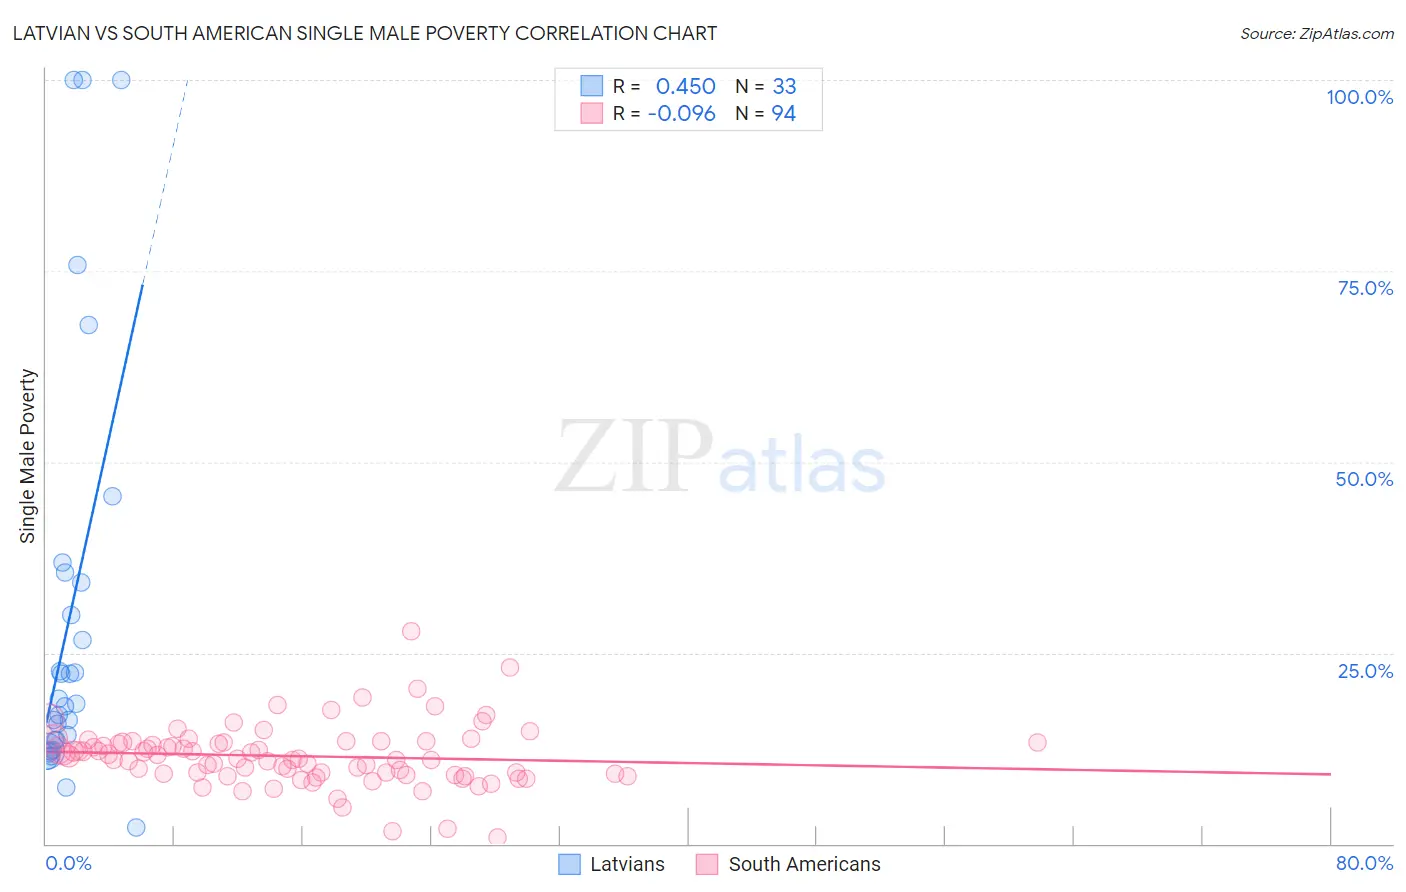
Latvian vs South American Single Male Poverty Correlation Chart
The statistical analysis conducted on geographies consisting of 199,264,855 people shows a moderate positive correlation between the proportion of Latvians and poverty level among single males in the United States with a correlation coefficient (R) of 0.450 and weighted average of 12.7%. Similarly, the statistical analysis conducted on geographies consisting of 426,067,746 people shows a slight negative correlation between the proportion of South Americans and poverty level among single males in the United States with a correlation coefficient (R) of -0.096 and weighted average of 12.1%, a difference of 4.8%.
Single Male Poverty Correlation Summary
| Measurement | Latvian | South American |
| Minimum | 2.2% | 0.77% |
| Maximum | 100.0% | 27.8% |
| Range | 97.8% | 27.1% |
| Mean | 29.8% | 11.5% |
| Median | 18.3% | 11.3% |
| Interquartile 25% (IQ1) | 13.0% | 9.1% |
| Interquartile 75% (IQ3) | 34.9% | 13.3% |
| Interquartile Range (IQR) | 21.9% | 4.1% |
| Standard Deviation (Sample) | 27.4% | 4.0% |
| Standard Deviation (Population) | 27.0% | 4.0% |
Similar Demographics by Single Male Poverty
Demographics Similar to Latvians by Single Male Poverty
In terms of single male poverty, the demographic groups most similar to Latvians are Vietnamese (12.7%, a difference of 0.0%), Immigrants from Spain (12.7%, a difference of 0.040%), Immigrants from Scotland (12.7%, a difference of 0.060%), Immigrants (12.7%, a difference of 0.13%), and Immigrants from Middle Africa (12.7%, a difference of 0.18%).
| Demographics | Rating | Rank | Single Male Poverty |
| Immigrants | Panama | 72.1 /100 | #150 | Good 12.6% |
| Immigrants | Hungary | 71.9 /100 | #151 | Good 12.6% |
| Australians | 71.4 /100 | #152 | Good 12.6% |
| Immigrants | Immigrants | 70.1 /100 | #153 | Good 12.7% |
| Immigrants | Scotland | 68.9 /100 | #154 | Good 12.7% |
| Immigrants | Spain | 68.7 /100 | #155 | Good 12.7% |
| Vietnamese | 67.9 /100 | #156 | Good 12.7% |
| Latvians | 67.9 /100 | #157 | Good 12.7% |
| Immigrants | Middle Africa | 64.9 /100 | #158 | Good 12.7% |
| Immigrants | Liberia | 64.2 /100 | #159 | Good 12.7% |
| Greeks | 64.1 /100 | #160 | Good 12.7% |
| Immigrants | Africa | 63.4 /100 | #161 | Good 12.7% |
| Eastern Europeans | 63.3 /100 | #162 | Good 12.7% |
| Palestinians | 63.1 /100 | #163 | Good 12.7% |
| Immigrants | Nigeria | 62.8 /100 | #164 | Good 12.7% |
Demographics Similar to South Americans by Single Male Poverty
In terms of single male poverty, the demographic groups most similar to South Americans are Immigrants from Eritrea (12.1%, a difference of 0.0%), Immigrants from Israel (12.1%, a difference of 0.010%), Turkish (12.1%, a difference of 0.030%), Immigrants from Czechoslovakia (12.1%, a difference of 0.11%), and Immigrants from Chile (12.1%, a difference of 0.13%).
| Demographics | Rating | Rank | Single Male Poverty |
| Armenians | 98.7 /100 | #80 | Exceptional 12.1% |
| Immigrants | South America | 98.7 /100 | #81 | Exceptional 12.1% |
| Immigrants | Colombia | 98.6 /100 | #82 | Exceptional 12.1% |
| Immigrants | Chile | 98.6 /100 | #83 | Exceptional 12.1% |
| Immigrants | Czechoslovakia | 98.6 /100 | #84 | Exceptional 12.1% |
| Turks | 98.5 /100 | #85 | Exceptional 12.1% |
| Immigrants | Israel | 98.5 /100 | #86 | Exceptional 12.1% |
| South Americans | 98.5 /100 | #87 | Exceptional 12.1% |
| Immigrants | Eritrea | 98.5 /100 | #88 | Exceptional 12.1% |
| Immigrants | Ireland | 98.3 /100 | #89 | Exceptional 12.1% |
| South American Indians | 98.3 /100 | #90 | Exceptional 12.1% |
| Immigrants | Turkey | 98.2 /100 | #91 | Exceptional 12.1% |
| Spanish American Indians | 98.0 /100 | #92 | Exceptional 12.1% |
| Immigrants | Bosnia and Herzegovina | 97.9 /100 | #93 | Exceptional 12.1% |
| Colombians | 97.8 /100 | #94 | Exceptional 12.2% |