Canadian vs Cree Single Male Poverty
COMPARE
Canadian
Cree
Single Male Poverty
Single Male Poverty Comparison
Canadians
Cree
13.3%
SINGLE MALE POVERTY
4.0/ 100
METRIC RATING
234th/ 347
METRIC RANK
15.1%
SINGLE MALE POVERTY
0.0/ 100
METRIC RATING
300th/ 347
METRIC RANK
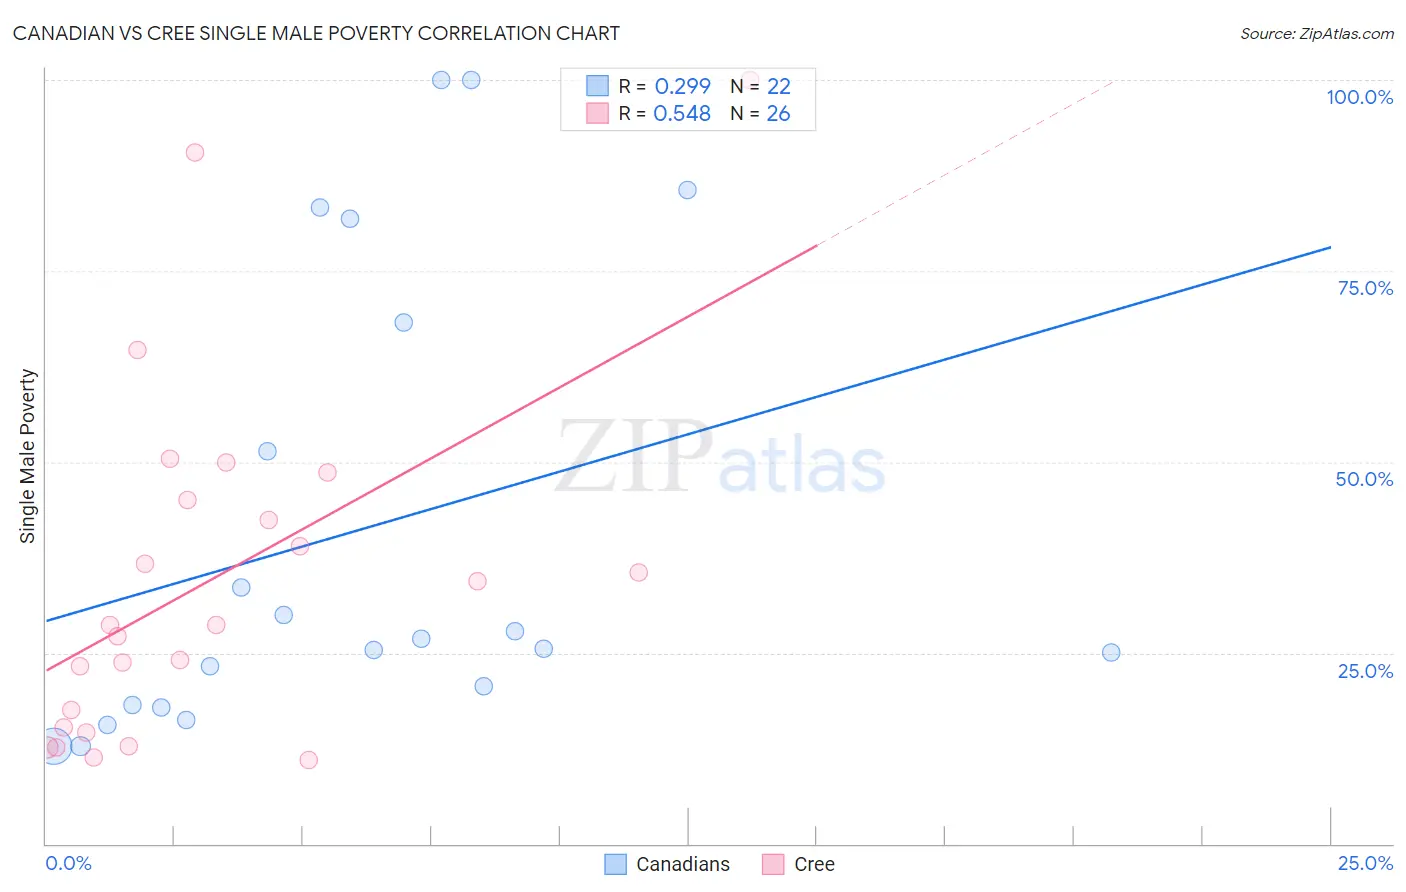
Canadian vs Cree Single Male Poverty Correlation Chart
The statistical analysis conducted on geographies consisting of 379,144,992 people shows a weak positive correlation between the proportion of Canadians and poverty level among single males in the United States with a correlation coefficient (R) of 0.299 and weighted average of 13.3%. Similarly, the statistical analysis conducted on geographies consisting of 73,575,391 people shows a substantial positive correlation between the proportion of Cree and poverty level among single males in the United States with a correlation coefficient (R) of 0.548 and weighted average of 15.1%, a difference of 13.2%.
Single Male Poverty Correlation Summary
| Measurement | Canadian | Cree |
| Minimum | 12.8% | 11.0% |
| Maximum | 100.0% | 100.0% |
| Range | 87.2% | 89.0% |
| Mean | 41.0% | 34.6% |
| Median | 26.2% | 28.6% |
| Interquartile 25% (IQ1) | 18.1% | 15.2% |
| Interquartile 75% (IQ3) | 68.3% | 45.0% |
| Interquartile Range (IQR) | 50.1% | 29.8% |
| Standard Deviation (Sample) | 30.2% | 23.1% |
| Standard Deviation (Population) | 29.5% | 22.6% |
Similar Demographics by Single Male Poverty
Demographics Similar to Canadians by Single Male Poverty
In terms of single male poverty, the demographic groups most similar to Canadians are British (13.3%, a difference of 0.0%), Bangladeshi (13.3%, a difference of 0.10%), Luxembourger (13.4%, a difference of 0.15%), British West Indian (13.4%, a difference of 0.21%), and Immigrants from Caribbean (13.3%, a difference of 0.29%).
| Demographics | Rating | Rank | Single Male Poverty |
| Haitians | 7.0 /100 | #227 | Tragic 13.2% |
| Lebanese | 6.6 /100 | #228 | Tragic 13.2% |
| Europeans | 6.2 /100 | #229 | Tragic 13.3% |
| Ghanaians | 6.1 /100 | #230 | Tragic 13.3% |
| Slavs | 5.3 /100 | #231 | Tragic 13.3% |
| Immigrants | Caribbean | 5.0 /100 | #232 | Tragic 13.3% |
| British | 4.0 /100 | #233 | Tragic 13.3% |
| Canadians | 4.0 /100 | #234 | Tragic 13.3% |
| Bangladeshis | 3.7 /100 | #235 | Tragic 13.3% |
| Luxembourgers | 3.6 /100 | #236 | Tragic 13.4% |
| British West Indians | 3.4 /100 | #237 | Tragic 13.4% |
| Immigrants | Ghana | 3.2 /100 | #238 | Tragic 13.4% |
| Czechoslovakians | 3.0 /100 | #239 | Tragic 13.4% |
| Belizeans | 2.3 /100 | #240 | Tragic 13.4% |
| Immigrants | Germany | 2.1 /100 | #241 | Tragic 13.4% |
Demographics Similar to Cree by Single Male Poverty
In terms of single male poverty, the demographic groups most similar to Cree are Delaware (15.0%, a difference of 0.45%), Dominican (15.2%, a difference of 0.82%), French American Indian (15.0%, a difference of 0.84%), Alsatian (15.2%, a difference of 0.98%), and Aleut (15.4%, a difference of 2.0%).
| Demographics | Rating | Rank | Single Male Poverty |
| French Canadians | 0.0 /100 | #293 | Tragic 14.6% |
| Ottawa | 0.0 /100 | #294 | Tragic 14.6% |
| Scotch-Irish | 0.0 /100 | #295 | Tragic 14.7% |
| Africans | 0.0 /100 | #296 | Tragic 14.7% |
| Immigrants | Dominican Republic | 0.0 /100 | #297 | Tragic 14.8% |
| French American Indians | 0.0 /100 | #298 | Tragic 15.0% |
| Delaware | 0.0 /100 | #299 | Tragic 15.0% |
| Cree | 0.0 /100 | #300 | Tragic 15.1% |
| Dominicans | 0.0 /100 | #301 | Tragic 15.2% |
| Alsatians | 0.0 /100 | #302 | Tragic 15.2% |
| Aleuts | 0.0 /100 | #303 | Tragic 15.4% |
| Alaska Natives | 0.0 /100 | #304 | Tragic 15.4% |
| Blackfeet | 0.0 /100 | #305 | Tragic 15.5% |
| Pennsylvania Germans | 0.0 /100 | #306 | Tragic 15.6% |
| Ute | 0.0 /100 | #307 | Tragic 15.7% |