Canadian vs Italian Single Male Poverty
COMPARE
Canadian
Italian
Single Male Poverty
Single Male Poverty Comparison
Canadians
Italians
13.3%
SINGLE MALE POVERTY
4.0/ 100
METRIC RATING
234th/ 347
METRIC RANK
13.1%
SINGLE MALE POVERTY
15.9/ 100
METRIC RATING
213th/ 347
METRIC RANK
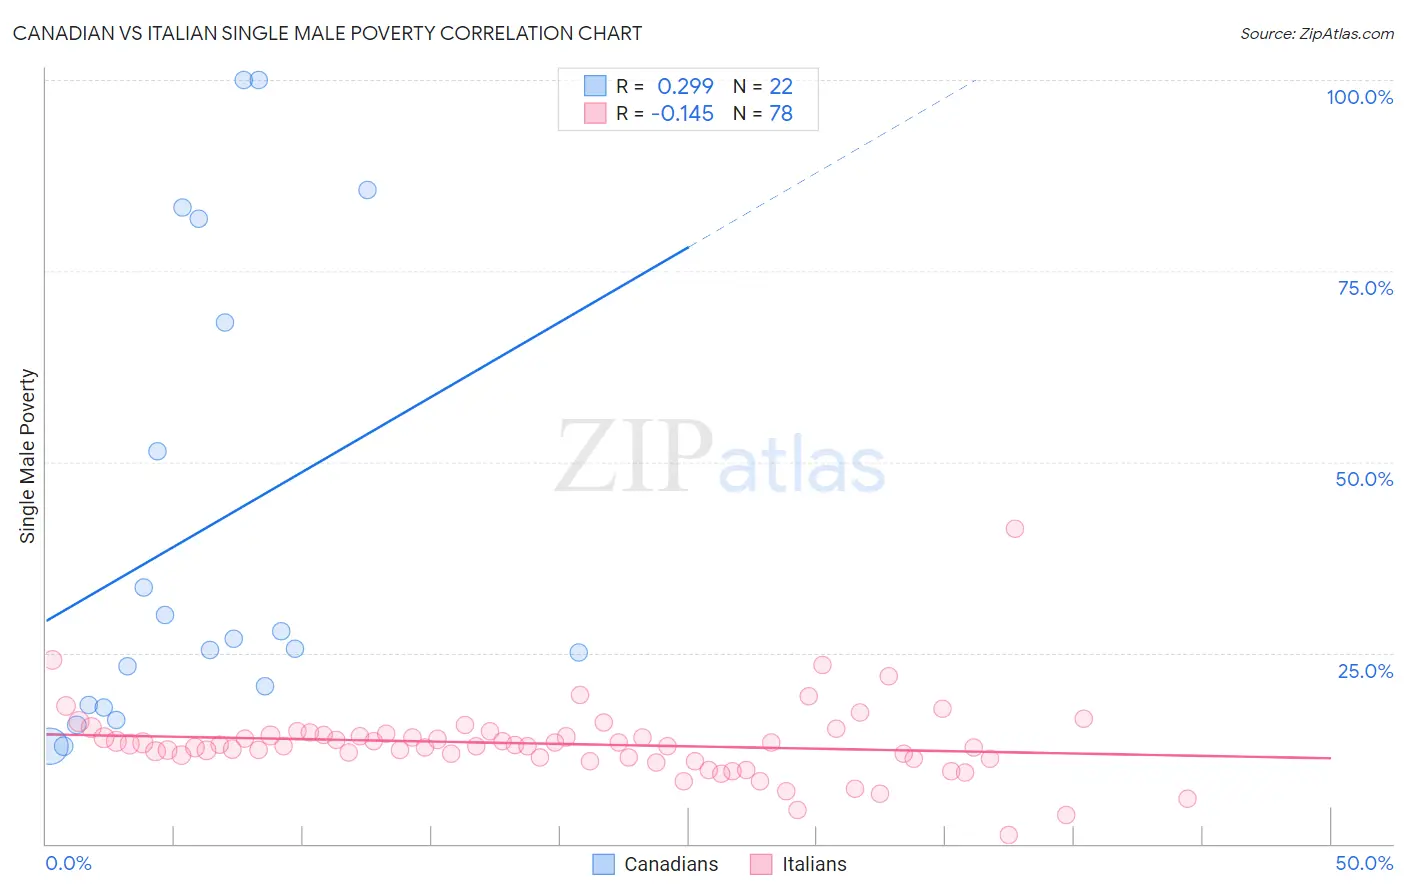
Canadian vs Italian Single Male Poverty Correlation Chart
The statistical analysis conducted on geographies consisting of 379,144,992 people shows a weak positive correlation between the proportion of Canadians and poverty level among single males in the United States with a correlation coefficient (R) of 0.299 and weighted average of 13.3%. Similarly, the statistical analysis conducted on geographies consisting of 474,306,770 people shows a poor negative correlation between the proportion of Italians and poverty level among single males in the United States with a correlation coefficient (R) of -0.145 and weighted average of 13.1%, a difference of 1.9%.
Single Male Poverty Correlation Summary
| Measurement | Canadian | Italian |
| Minimum | 12.8% | 1.1% |
| Maximum | 100.0% | 41.2% |
| Range | 87.2% | 40.1% |
| Mean | 41.0% | 13.1% |
| Median | 26.2% | 12.9% |
| Interquartile 25% (IQ1) | 18.1% | 11.2% |
| Interquartile 75% (IQ3) | 68.3% | 14.3% |
| Interquartile Range (IQR) | 50.1% | 3.1% |
| Standard Deviation (Sample) | 30.2% | 5.0% |
| Standard Deviation (Population) | 29.5% | 5.0% |
Similar Demographics by Single Male Poverty
Demographics Similar to Canadians by Single Male Poverty
In terms of single male poverty, the demographic groups most similar to Canadians are British (13.3%, a difference of 0.0%), Bangladeshi (13.3%, a difference of 0.10%), Luxembourger (13.4%, a difference of 0.15%), British West Indian (13.4%, a difference of 0.21%), and Immigrants from Caribbean (13.3%, a difference of 0.29%).
| Demographics | Rating | Rank | Single Male Poverty |
| Haitians | 7.0 /100 | #227 | Tragic 13.2% |
| Lebanese | 6.6 /100 | #228 | Tragic 13.2% |
| Europeans | 6.2 /100 | #229 | Tragic 13.3% |
| Ghanaians | 6.1 /100 | #230 | Tragic 13.3% |
| Slavs | 5.3 /100 | #231 | Tragic 13.3% |
| Immigrants | Caribbean | 5.0 /100 | #232 | Tragic 13.3% |
| British | 4.0 /100 | #233 | Tragic 13.3% |
| Canadians | 4.0 /100 | #234 | Tragic 13.3% |
| Bangladeshis | 3.7 /100 | #235 | Tragic 13.3% |
| Luxembourgers | 3.6 /100 | #236 | Tragic 13.4% |
| British West Indians | 3.4 /100 | #237 | Tragic 13.4% |
| Immigrants | Ghana | 3.2 /100 | #238 | Tragic 13.4% |
| Czechoslovakians | 3.0 /100 | #239 | Tragic 13.4% |
| Belizeans | 2.3 /100 | #240 | Tragic 13.4% |
| Immigrants | Germany | 2.1 /100 | #241 | Tragic 13.4% |
Demographics Similar to Italians by Single Male Poverty
In terms of single male poverty, the demographic groups most similar to Italians are Senegalese (13.1%, a difference of 0.050%), Swedish (13.1%, a difference of 0.080%), Immigrants from Haiti (13.1%, a difference of 0.090%), Zimbabwean (13.1%, a difference of 0.090%), and Japanese (13.1%, a difference of 0.11%).
| Demographics | Rating | Rank | Single Male Poverty |
| Northern Europeans | 18.9 /100 | #206 | Poor 13.0% |
| Sudanese | 17.7 /100 | #207 | Poor 13.1% |
| Immigrants | Western Africa | 17.6 /100 | #208 | Poor 13.1% |
| Mexican American Indians | 17.5 /100 | #209 | Poor 13.1% |
| Immigrants | Haiti | 16.8 /100 | #210 | Poor 13.1% |
| Swedes | 16.8 /100 | #211 | Poor 13.1% |
| Senegalese | 16.4 /100 | #212 | Poor 13.1% |
| Italians | 15.9 /100 | #213 | Poor 13.1% |
| Zimbabweans | 14.9 /100 | #214 | Poor 13.1% |
| Japanese | 14.8 /100 | #215 | Poor 13.1% |
| Austrians | 13.9 /100 | #216 | Poor 13.1% |
| Bermudans | 13.0 /100 | #217 | Poor 13.1% |
| Scandinavians | 12.9 /100 | #218 | Poor 13.1% |
| Immigrants | Burma/Myanmar | 12.6 /100 | #219 | Poor 13.1% |
| Central Americans | 10.9 /100 | #220 | Poor 13.2% |