Canadian vs Immigrants from Hungary Single Male Poverty
COMPARE
Canadian
Immigrants from Hungary
Single Male Poverty
Single Male Poverty Comparison
Canadians
Immigrants from Hungary
13.3%
SINGLE MALE POVERTY
4.0/ 100
METRIC RATING
234th/ 347
METRIC RANK
12.6%
SINGLE MALE POVERTY
71.9/ 100
METRIC RATING
151st/ 347
METRIC RANK
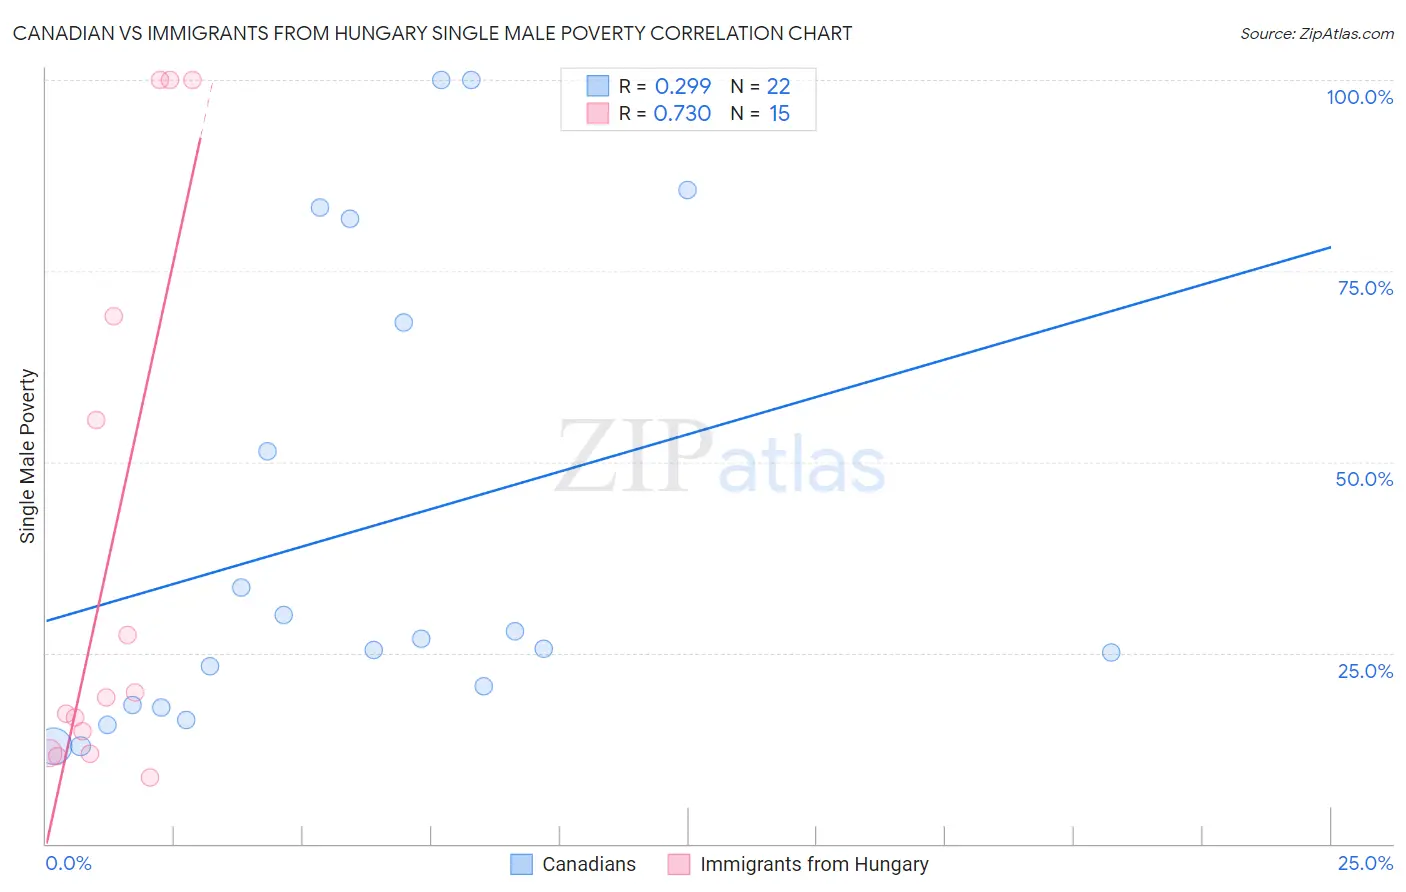
Canadian vs Immigrants from Hungary Single Male Poverty Correlation Chart
The statistical analysis conducted on geographies consisting of 379,144,992 people shows a weak positive correlation between the proportion of Canadians and poverty level among single males in the United States with a correlation coefficient (R) of 0.299 and weighted average of 13.3%. Similarly, the statistical analysis conducted on geographies consisting of 178,525,850 people shows a strong positive correlation between the proportion of Immigrants from Hungary and poverty level among single males in the United States with a correlation coefficient (R) of 0.730 and weighted average of 12.6%, a difference of 5.5%.
Single Male Poverty Correlation Summary
| Measurement | Canadian | Immigrants from Hungary |
| Minimum | 12.8% | 8.7% |
| Maximum | 100.0% | 100.0% |
| Range | 87.2% | 91.3% |
| Mean | 41.0% | 38.9% |
| Median | 26.2% | 19.1% |
| Interquartile 25% (IQ1) | 18.1% | 11.9% |
| Interquartile 75% (IQ3) | 68.3% | 69.1% |
| Interquartile Range (IQR) | 50.1% | 57.2% |
| Standard Deviation (Sample) | 30.2% | 35.8% |
| Standard Deviation (Population) | 29.5% | 34.6% |
Similar Demographics by Single Male Poverty
Demographics Similar to Canadians by Single Male Poverty
In terms of single male poverty, the demographic groups most similar to Canadians are British (13.3%, a difference of 0.0%), Bangladeshi (13.3%, a difference of 0.10%), Luxembourger (13.4%, a difference of 0.15%), British West Indian (13.4%, a difference of 0.21%), and Immigrants from Caribbean (13.3%, a difference of 0.29%).
| Demographics | Rating | Rank | Single Male Poverty |
| Haitians | 7.0 /100 | #227 | Tragic 13.2% |
| Lebanese | 6.6 /100 | #228 | Tragic 13.2% |
| Europeans | 6.2 /100 | #229 | Tragic 13.3% |
| Ghanaians | 6.1 /100 | #230 | Tragic 13.3% |
| Slavs | 5.3 /100 | #231 | Tragic 13.3% |
| Immigrants | Caribbean | 5.0 /100 | #232 | Tragic 13.3% |
| British | 4.0 /100 | #233 | Tragic 13.3% |
| Canadians | 4.0 /100 | #234 | Tragic 13.3% |
| Bangladeshis | 3.7 /100 | #235 | Tragic 13.3% |
| Luxembourgers | 3.6 /100 | #236 | Tragic 13.4% |
| British West Indians | 3.4 /100 | #237 | Tragic 13.4% |
| Immigrants | Ghana | 3.2 /100 | #238 | Tragic 13.4% |
| Czechoslovakians | 3.0 /100 | #239 | Tragic 13.4% |
| Belizeans | 2.3 /100 | #240 | Tragic 13.4% |
| Immigrants | Germany | 2.1 /100 | #241 | Tragic 13.4% |
Demographics Similar to Immigrants from Hungary by Single Male Poverty
In terms of single male poverty, the demographic groups most similar to Immigrants from Hungary are Immigrants from Panama (12.6%, a difference of 0.010%), Australian (12.6%, a difference of 0.030%), Sierra Leonean (12.6%, a difference of 0.070%), Immigrants (12.7%, a difference of 0.12%), and Yugoslavian (12.6%, a difference of 0.14%).
| Demographics | Rating | Rank | Single Male Poverty |
| Hawaiians | 75.1 /100 | #144 | Good 12.6% |
| Immigrants | Lebanon | 75.0 /100 | #145 | Good 12.6% |
| Native Hawaiians | 75.0 /100 | #146 | Good 12.6% |
| Malaysians | 74.8 /100 | #147 | Good 12.6% |
| Yugoslavians | 73.9 /100 | #148 | Good 12.6% |
| Sierra Leoneans | 73.0 /100 | #149 | Good 12.6% |
| Immigrants | Panama | 72.1 /100 | #150 | Good 12.6% |
| Immigrants | Hungary | 71.9 /100 | #151 | Good 12.6% |
| Australians | 71.4 /100 | #152 | Good 12.6% |
| Immigrants | Immigrants | 70.1 /100 | #153 | Good 12.7% |
| Immigrants | Scotland | 68.9 /100 | #154 | Good 12.7% |
| Immigrants | Spain | 68.7 /100 | #155 | Good 12.7% |
| Vietnamese | 67.9 /100 | #156 | Good 12.7% |
| Latvians | 67.9 /100 | #157 | Good 12.7% |
| Immigrants | Middle Africa | 64.9 /100 | #158 | Good 12.7% |