Bulgarian vs Paraguayan Single Female Poverty
COMPARE
Bulgarian
Paraguayan
Single Female Poverty
Single Female Poverty Comparison
Bulgarians
Paraguayans
18.8%
SINGLE FEMALE POVERTY
99.9/ 100
METRIC RATING
39th/ 347
METRIC RANK
19.3%
SINGLE FEMALE POVERTY
99.5/ 100
METRIC RATING
69th/ 347
METRIC RANK
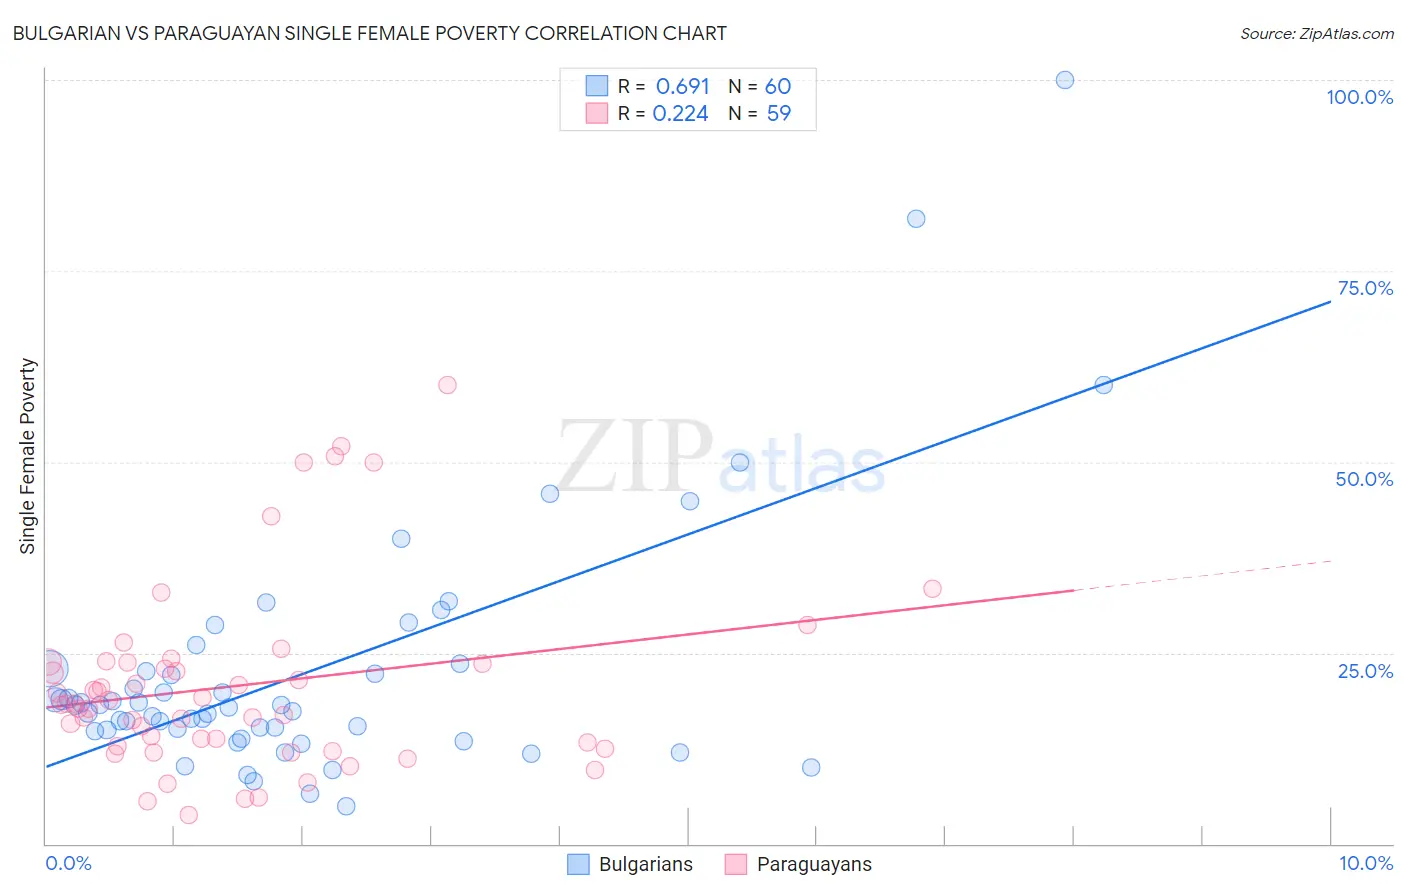
Bulgarian vs Paraguayan Single Female Poverty Correlation Chart
The statistical analysis conducted on geographies consisting of 203,529,625 people shows a significant positive correlation between the proportion of Bulgarians and poverty level among single females in the United States with a correlation coefficient (R) of 0.691 and weighted average of 18.8%. Similarly, the statistical analysis conducted on geographies consisting of 94,675,073 people shows a weak positive correlation between the proportion of Paraguayans and poverty level among single females in the United States with a correlation coefficient (R) of 0.224 and weighted average of 19.3%, a difference of 2.7%.
Single Female Poverty Correlation Summary
| Measurement | Bulgarian | Paraguayan |
| Minimum | 5.0% | 3.7% |
| Maximum | 100.0% | 60.0% |
| Range | 95.0% | 56.3% |
| Mean | 22.4% | 20.7% |
| Median | 18.0% | 18.3% |
| Interquartile 25% (IQ1) | 14.8% | 12.7% |
| Interquartile 75% (IQ3) | 22.7% | 23.7% |
| Interquartile Range (IQR) | 7.9% | 11.0% |
| Standard Deviation (Sample) | 16.6% | 12.1% |
| Standard Deviation (Population) | 16.5% | 12.0% |
Similar Demographics by Single Female Poverty
Demographics Similar to Bulgarians by Single Female Poverty
In terms of single female poverty, the demographic groups most similar to Bulgarians are Tongan (18.8%, a difference of 0.030%), Okinawan (18.8%, a difference of 0.030%), Immigrants from Serbia (18.8%, a difference of 0.050%), Jordanian (18.8%, a difference of 0.13%), and Immigrants from Romania (18.8%, a difference of 0.28%).
| Demographics | Rating | Rank | Single Female Poverty |
| Immigrants | Sri Lanka | 99.9 /100 | #32 | Exceptional 18.6% |
| Immigrants | Philippines | 99.9 /100 | #33 | Exceptional 18.6% |
| Koreans | 99.9 /100 | #34 | Exceptional 18.6% |
| Immigrants | Japan | 99.9 /100 | #35 | Exceptional 18.6% |
| Turks | 99.9 /100 | #36 | Exceptional 18.7% |
| Immigrants | Armenia | 99.9 /100 | #37 | Exceptional 18.7% |
| Tongans | 99.9 /100 | #38 | Exceptional 18.8% |
| Bulgarians | 99.9 /100 | #39 | Exceptional 18.8% |
| Okinawans | 99.9 /100 | #40 | Exceptional 18.8% |
| Immigrants | Serbia | 99.9 /100 | #41 | Exceptional 18.8% |
| Jordanians | 99.9 /100 | #42 | Exceptional 18.8% |
| Immigrants | Romania | 99.9 /100 | #43 | Exceptional 18.8% |
| Immigrants | Croatia | 99.9 /100 | #44 | Exceptional 18.9% |
| Immigrants | Indonesia | 99.8 /100 | #45 | Exceptional 18.9% |
| Macedonians | 99.8 /100 | #46 | Exceptional 18.9% |
Demographics Similar to Paraguayans by Single Female Poverty
In terms of single female poverty, the demographic groups most similar to Paraguayans are Immigrants from Jordan (19.3%, a difference of 0.060%), Immigrants from South Eastern Asia (19.3%, a difference of 0.13%), Immigrants from Latvia (19.3%, a difference of 0.14%), Immigrants from Peru (19.3%, a difference of 0.23%), and Laotian (19.3%, a difference of 0.25%).
| Demographics | Rating | Rank | Single Female Poverty |
| Lithuanians | 99.6 /100 | #62 | Exceptional 19.2% |
| Immigrants | Northern Europe | 99.6 /100 | #63 | Exceptional 19.2% |
| Immigrants | Europe | 99.6 /100 | #64 | Exceptional 19.2% |
| Cypriots | 99.6 /100 | #65 | Exceptional 19.2% |
| Palestinians | 99.6 /100 | #66 | Exceptional 19.2% |
| Immigrants | Egypt | 99.6 /100 | #67 | Exceptional 19.2% |
| Laotians | 99.5 /100 | #68 | Exceptional 19.3% |
| Paraguayans | 99.5 /100 | #69 | Exceptional 19.3% |
| Immigrants | Jordan | 99.4 /100 | #70 | Exceptional 19.3% |
| Immigrants | South Eastern Asia | 99.4 /100 | #71 | Exceptional 19.3% |
| Immigrants | Latvia | 99.4 /100 | #72 | Exceptional 19.3% |
| Immigrants | Peru | 99.4 /100 | #73 | Exceptional 19.3% |
| Immigrants | Belarus | 99.4 /100 | #74 | Exceptional 19.3% |
| Immigrants | Turkey | 99.4 /100 | #75 | Exceptional 19.4% |
| Peruvians | 99.4 /100 | #76 | Exceptional 19.4% |