Canadian vs Nepalese Family Poverty
COMPARE
Canadian
Nepalese
Family Poverty
Family Poverty Comparison
Canadians
Nepalese
8.2%
FAMILY POVERTY
94.2/ 100
METRIC RATING
113th/ 347
METRIC RANK
10.4%
FAMILY POVERTY
0.8/ 100
METRIC RATING
243rd/ 347
METRIC RANK
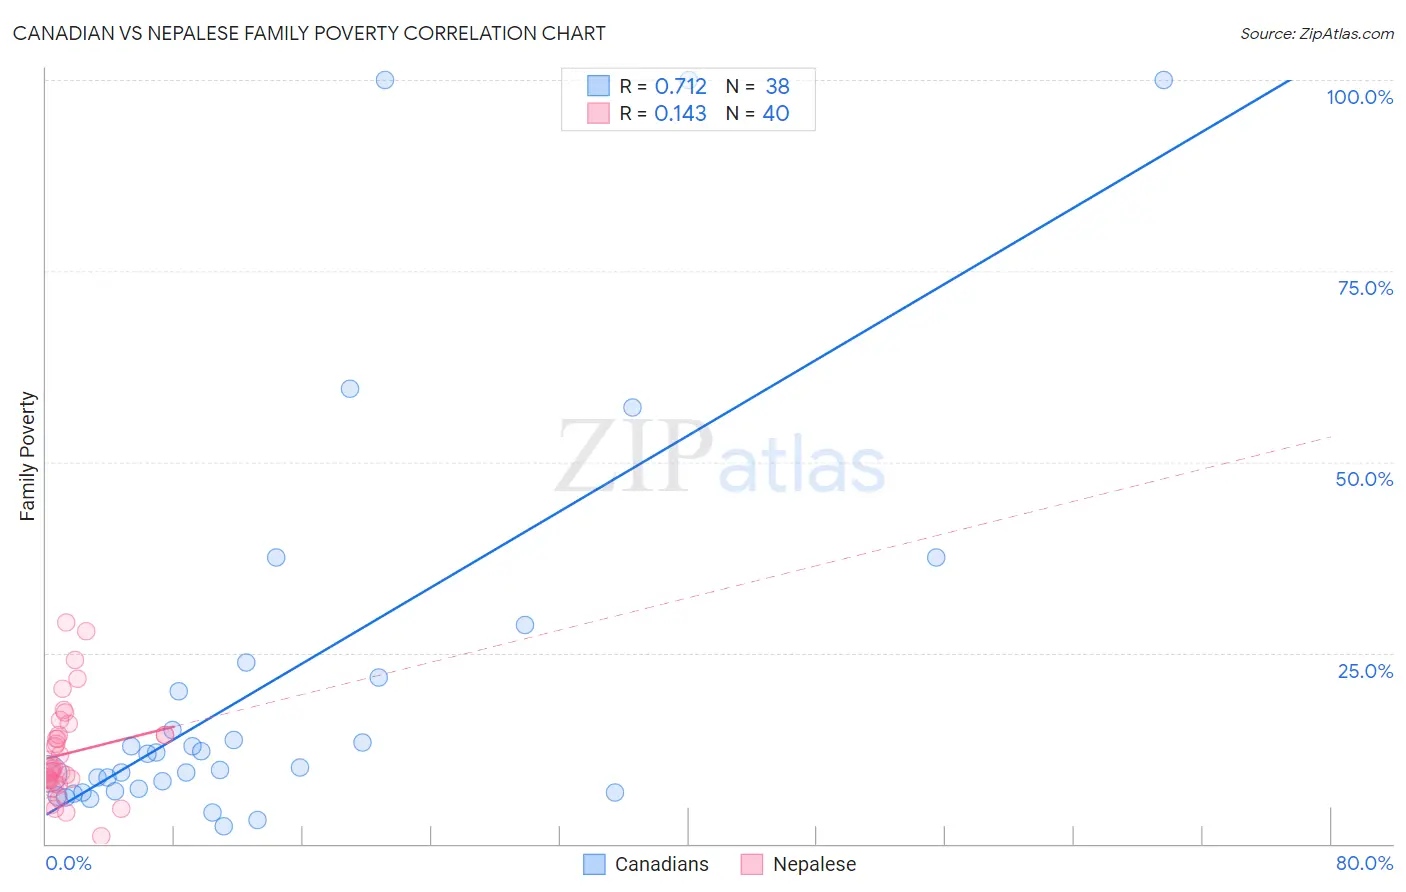
Canadian vs Nepalese Family Poverty Correlation Chart
The statistical analysis conducted on geographies consisting of 435,772,566 people shows a strong positive correlation between the proportion of Canadians and poverty level among families in the United States with a correlation coefficient (R) of 0.712 and weighted average of 8.2%. Similarly, the statistical analysis conducted on geographies consisting of 24,521,755 people shows a poor positive correlation between the proportion of Nepalese and poverty level among families in the United States with a correlation coefficient (R) of 0.143 and weighted average of 10.4%, a difference of 27.3%.
Family Poverty Correlation Summary
| Measurement | Canadian | Nepalese |
| Minimum | 2.3% | 0.90% |
| Maximum | 100.0% | 28.9% |
| Range | 97.7% | 28.0% |
| Mean | 21.7% | 11.8% |
| Median | 10.9% | 9.7% |
| Interquartile 25% (IQ1) | 6.9% | 8.1% |
| Interquartile 75% (IQ3) | 21.7% | 14.2% |
| Interquartile Range (IQR) | 14.9% | 6.1% |
| Standard Deviation (Sample) | 26.7% | 6.2% |
| Standard Deviation (Population) | 26.4% | 6.2% |
Similar Demographics by Family Poverty
Demographics Similar to Canadians by Family Poverty
In terms of family poverty, the demographic groups most similar to Canadians are Immigrants from Zimbabwe (8.2%, a difference of 0.090%), Immigrants from France (8.2%, a difference of 0.17%), Taiwanese (8.2%, a difference of 0.28%), Romanian (8.2%, a difference of 0.33%), and Jordanian (8.2%, a difference of 0.42%).
| Demographics | Rating | Rank | Family Poverty |
| Egyptians | 95.1 /100 | #106 | Exceptional 8.1% |
| French Canadians | 95.0 /100 | #107 | Exceptional 8.1% |
| Basques | 94.9 /100 | #108 | Exceptional 8.1% |
| Jordanians | 94.8 /100 | #109 | Exceptional 8.2% |
| Romanians | 94.7 /100 | #110 | Exceptional 8.2% |
| Taiwanese | 94.6 /100 | #111 | Exceptional 8.2% |
| Immigrants | France | 94.4 /100 | #112 | Exceptional 8.2% |
| Canadians | 94.2 /100 | #113 | Exceptional 8.2% |
| Immigrants | Zimbabwe | 94.0 /100 | #114 | Exceptional 8.2% |
| Immigrants | Israel | 93.5 /100 | #115 | Exceptional 8.2% |
| South Africans | 93.4 /100 | #116 | Exceptional 8.2% |
| Immigrants | Russia | 93.2 /100 | #117 | Exceptional 8.2% |
| Immigrants | Western Europe | 92.9 /100 | #118 | Exceptional 8.2% |
| French | 92.8 /100 | #119 | Exceptional 8.3% |
| Immigrants | Egypt | 91.6 /100 | #120 | Exceptional 8.3% |
Demographics Similar to Nepalese by Family Poverty
In terms of family poverty, the demographic groups most similar to Nepalese are Cree (10.5%, a difference of 0.46%), Alaska Native (10.4%, a difference of 0.48%), Immigrants from Burma/Myanmar (10.5%, a difference of 1.1%), Ghanaian (10.3%, a difference of 1.3%), and Immigrants from the Azores (10.3%, a difference of 1.4%).
| Demographics | Rating | Rank | Family Poverty |
| Immigrants | Nigeria | 1.9 /100 | #236 | Tragic 10.2% |
| Immigrants | Laos | 1.7 /100 | #237 | Tragic 10.2% |
| French American Indians | 1.5 /100 | #238 | Tragic 10.2% |
| Potawatomi | 1.5 /100 | #239 | Tragic 10.2% |
| Immigrants | Azores | 1.4 /100 | #240 | Tragic 10.3% |
| Ghanaians | 1.3 /100 | #241 | Tragic 10.3% |
| Alaska Natives | 1.0 /100 | #242 | Tragic 10.4% |
| Nepalese | 0.8 /100 | #243 | Tragic 10.4% |
| Cree | 0.7 /100 | #244 | Tragic 10.5% |
| Immigrants | Burma/Myanmar | 0.6 /100 | #245 | Tragic 10.5% |
| Cherokee | 0.5 /100 | #246 | Tragic 10.6% |
| Liberians | 0.4 /100 | #247 | Tragic 10.6% |
| Nicaraguans | 0.4 /100 | #248 | Tragic 10.6% |
| Cubans | 0.4 /100 | #249 | Tragic 10.6% |
| Salvadorans | 0.3 /100 | #250 | Tragic 10.7% |