Delaware vs Italian Single Male Poverty
COMPARE
Delaware
Italian
Single Male Poverty
Single Male Poverty Comparison
Delaware
Italians
15.0%
SINGLE MALE POVERTY
0.0/ 100
METRIC RATING
299th/ 347
METRIC RANK
13.1%
SINGLE MALE POVERTY
15.9/ 100
METRIC RATING
213th/ 347
METRIC RANK
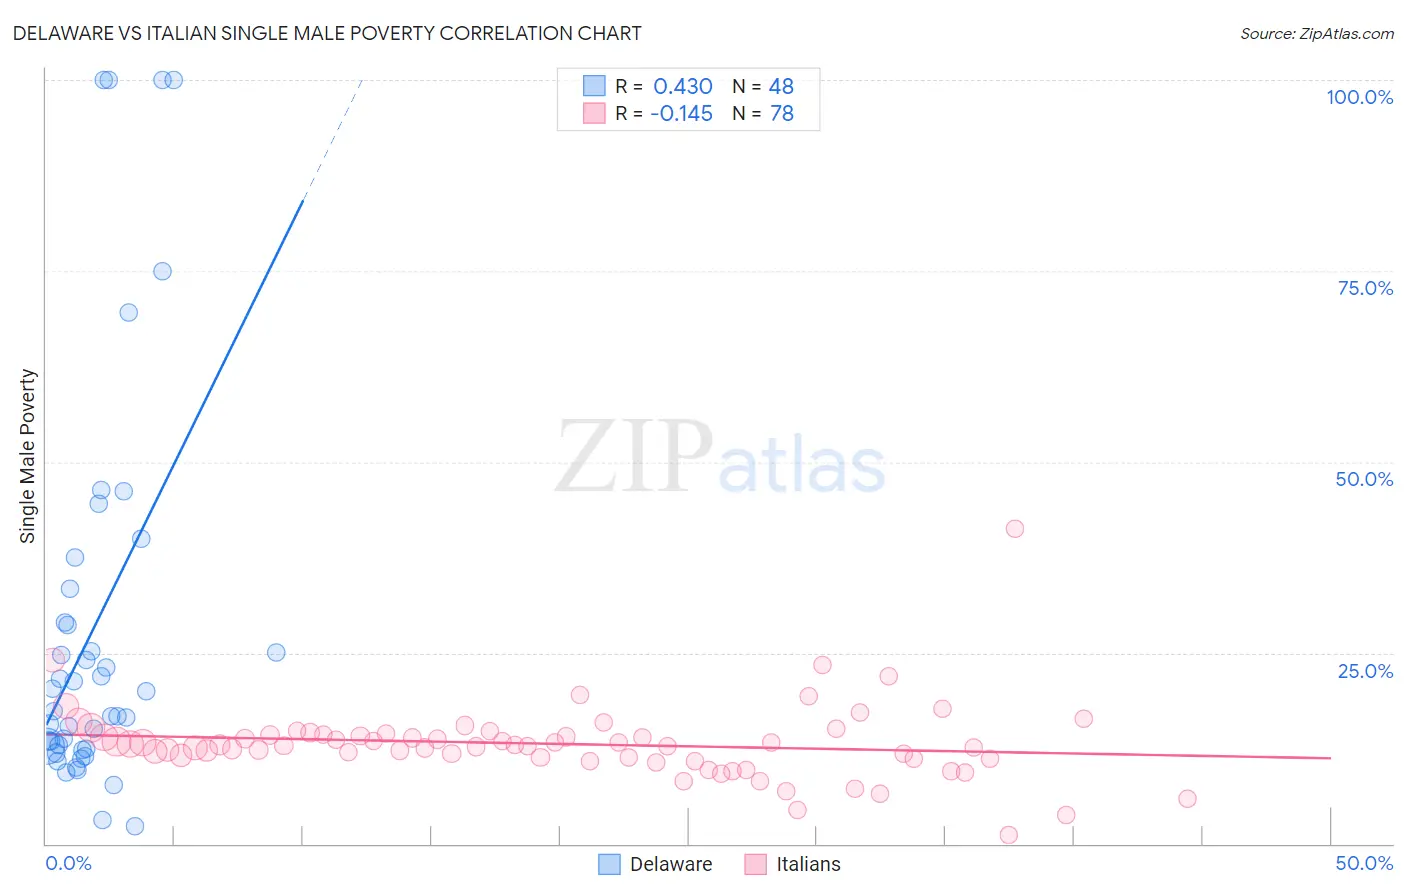
Delaware vs Italian Single Male Poverty Correlation Chart
The statistical analysis conducted on geographies consisting of 90,922,782 people shows a moderate positive correlation between the proportion of Delaware and poverty level among single males in the United States with a correlation coefficient (R) of 0.430 and weighted average of 15.0%. Similarly, the statistical analysis conducted on geographies consisting of 474,306,770 people shows a poor negative correlation between the proportion of Italians and poverty level among single males in the United States with a correlation coefficient (R) of -0.145 and weighted average of 13.1%, a difference of 14.9%.
Single Male Poverty Correlation Summary
| Measurement | Delaware | Italian |
| Minimum | 2.4% | 1.1% |
| Maximum | 100.0% | 41.2% |
| Range | 97.6% | 40.1% |
| Mean | 28.5% | 13.1% |
| Median | 18.7% | 12.9% |
| Interquartile 25% (IQ1) | 12.6% | 11.2% |
| Interquartile 75% (IQ3) | 31.1% | 14.3% |
| Interquartile Range (IQR) | 18.5% | 3.1% |
| Standard Deviation (Sample) | 26.3% | 5.0% |
| Standard Deviation (Population) | 26.0% | 5.0% |
Similar Demographics by Single Male Poverty
Demographics Similar to Delaware by Single Male Poverty
In terms of single male poverty, the demographic groups most similar to Delaware are French American Indian (15.0%, a difference of 0.39%), Cree (15.1%, a difference of 0.45%), Dominican (15.2%, a difference of 1.3%), Alsatian (15.2%, a difference of 1.4%), and Immigrants from Dominican Republic (14.8%, a difference of 1.7%).
| Demographics | Rating | Rank | Single Male Poverty |
| Immigrants | Nonimmigrants | 0.0 /100 | #292 | Tragic 14.6% |
| French Canadians | 0.0 /100 | #293 | Tragic 14.6% |
| Ottawa | 0.0 /100 | #294 | Tragic 14.6% |
| Scotch-Irish | 0.0 /100 | #295 | Tragic 14.7% |
| Africans | 0.0 /100 | #296 | Tragic 14.7% |
| Immigrants | Dominican Republic | 0.0 /100 | #297 | Tragic 14.8% |
| French American Indians | 0.0 /100 | #298 | Tragic 15.0% |
| Delaware | 0.0 /100 | #299 | Tragic 15.0% |
| Cree | 0.0 /100 | #300 | Tragic 15.1% |
| Dominicans | 0.0 /100 | #301 | Tragic 15.2% |
| Alsatians | 0.0 /100 | #302 | Tragic 15.2% |
| Aleuts | 0.0 /100 | #303 | Tragic 15.4% |
| Alaska Natives | 0.0 /100 | #304 | Tragic 15.4% |
| Blackfeet | 0.0 /100 | #305 | Tragic 15.5% |
| Pennsylvania Germans | 0.0 /100 | #306 | Tragic 15.6% |
Demographics Similar to Italians by Single Male Poverty
In terms of single male poverty, the demographic groups most similar to Italians are Senegalese (13.1%, a difference of 0.050%), Swedish (13.1%, a difference of 0.080%), Immigrants from Haiti (13.1%, a difference of 0.090%), Zimbabwean (13.1%, a difference of 0.090%), and Japanese (13.1%, a difference of 0.11%).
| Demographics | Rating | Rank | Single Male Poverty |
| Northern Europeans | 18.9 /100 | #206 | Poor 13.0% |
| Sudanese | 17.7 /100 | #207 | Poor 13.1% |
| Immigrants | Western Africa | 17.6 /100 | #208 | Poor 13.1% |
| Mexican American Indians | 17.5 /100 | #209 | Poor 13.1% |
| Immigrants | Haiti | 16.8 /100 | #210 | Poor 13.1% |
| Swedes | 16.8 /100 | #211 | Poor 13.1% |
| Senegalese | 16.4 /100 | #212 | Poor 13.1% |
| Italians | 15.9 /100 | #213 | Poor 13.1% |
| Zimbabweans | 14.9 /100 | #214 | Poor 13.1% |
| Japanese | 14.8 /100 | #215 | Poor 13.1% |
| Austrians | 13.9 /100 | #216 | Poor 13.1% |
| Bermudans | 13.0 /100 | #217 | Poor 13.1% |
| Scandinavians | 12.9 /100 | #218 | Poor 13.1% |
| Immigrants | Burma/Myanmar | 12.6 /100 | #219 | Poor 13.1% |
| Central Americans | 10.9 /100 | #220 | Poor 13.2% |