Immigrants from Pakistan vs Italian Single Male Poverty
COMPARE
Immigrants from Pakistan
Italian
Single Male Poverty
Single Male Poverty Comparison
Immigrants from Pakistan
Italians
11.2%
SINGLE MALE POVERTY
100.0/ 100
METRIC RATING
22nd/ 347
METRIC RANK
13.1%
SINGLE MALE POVERTY
15.9/ 100
METRIC RATING
213th/ 347
METRIC RANK
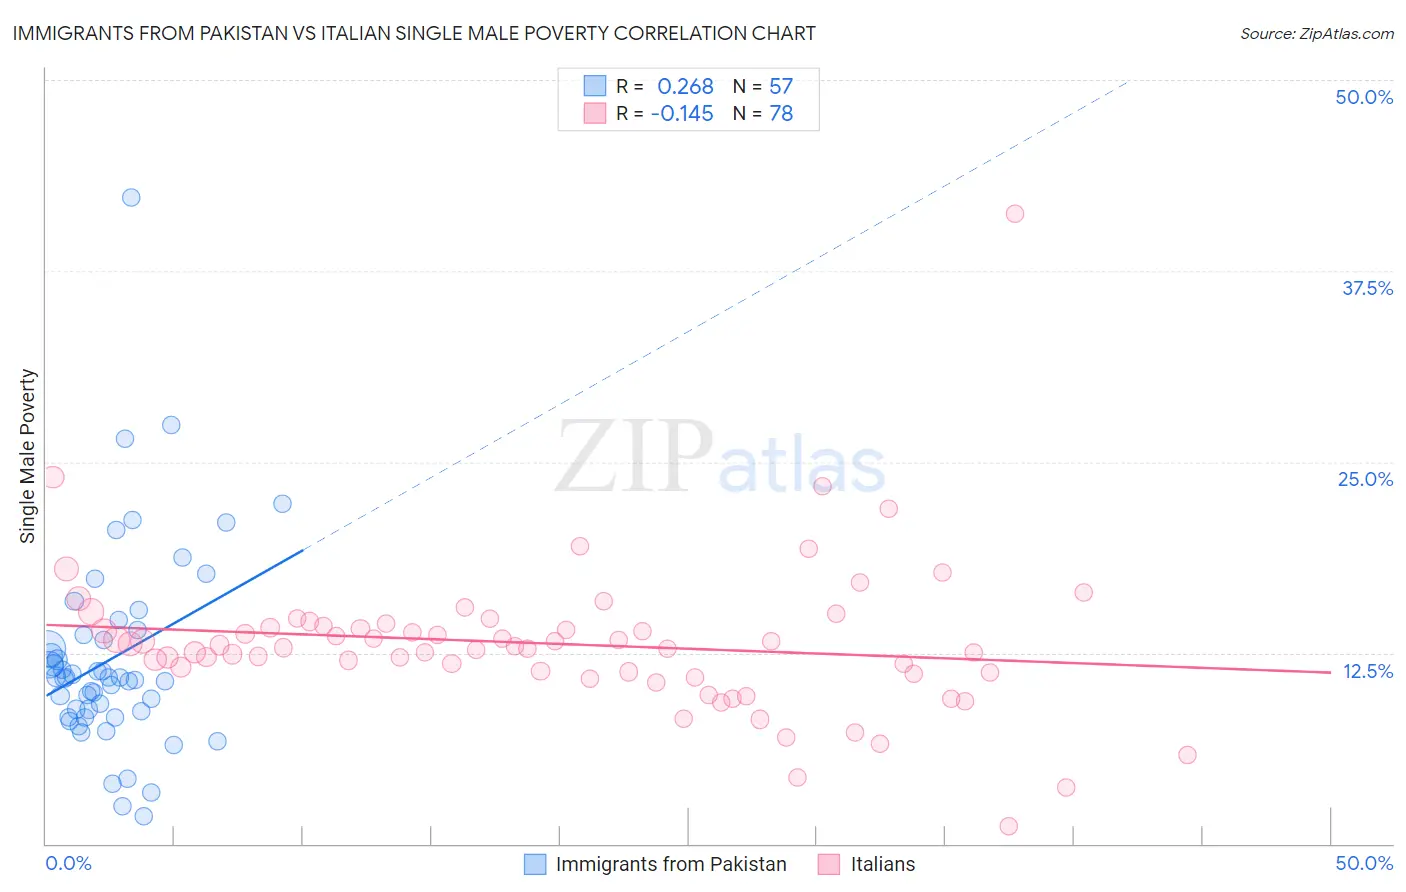
Immigrants from Pakistan vs Italian Single Male Poverty Correlation Chart
The statistical analysis conducted on geographies consisting of 256,771,473 people shows a weak positive correlation between the proportion of Immigrants from Pakistan and poverty level among single males in the United States with a correlation coefficient (R) of 0.268 and weighted average of 11.2%. Similarly, the statistical analysis conducted on geographies consisting of 474,306,770 people shows a poor negative correlation between the proportion of Italians and poverty level among single males in the United States with a correlation coefficient (R) of -0.145 and weighted average of 13.1%, a difference of 16.7%.
Single Male Poverty Correlation Summary
| Measurement | Immigrants from Pakistan | Italian |
| Minimum | 1.8% | 1.1% |
| Maximum | 42.3% | 41.2% |
| Range | 40.5% | 40.1% |
| Mean | 12.1% | 13.1% |
| Median | 10.9% | 12.9% |
| Interquartile 25% (IQ1) | 8.5% | 11.2% |
| Interquartile 75% (IQ3) | 13.8% | 14.3% |
| Interquartile Range (IQR) | 5.3% | 3.1% |
| Standard Deviation (Sample) | 6.7% | 5.0% |
| Standard Deviation (Population) | 6.6% | 5.0% |
Similar Demographics by Single Male Poverty
Demographics Similar to Immigrants from Pakistan by Single Male Poverty
In terms of single male poverty, the demographic groups most similar to Immigrants from Pakistan are Asian (11.2%, a difference of 0.090%), Bolivian (11.2%, a difference of 0.21%), Indian (Asian) (11.3%, a difference of 0.41%), Maltese (11.3%, a difference of 0.43%), and Ethiopian (11.2%, a difference of 0.44%).
| Demographics | Rating | Rank | Single Male Poverty |
| Koreans | 100.0 /100 | #15 | Exceptional 11.0% |
| Bhutanese | 100.0 /100 | #16 | Exceptional 11.1% |
| Tsimshian | 100.0 /100 | #17 | Exceptional 11.1% |
| Immigrants | Bolivia | 100.0 /100 | #18 | Exceptional 11.1% |
| Immigrants | Moldova | 100.0 /100 | #19 | Exceptional 11.2% |
| Ethiopians | 100.0 /100 | #20 | Exceptional 11.2% |
| Asians | 100.0 /100 | #21 | Exceptional 11.2% |
| Immigrants | Pakistan | 100.0 /100 | #22 | Exceptional 11.2% |
| Bolivians | 100.0 /100 | #23 | Exceptional 11.2% |
| Indians (Asian) | 100.0 /100 | #24 | Exceptional 11.3% |
| Maltese | 100.0 /100 | #25 | Exceptional 11.3% |
| Immigrants | Japan | 100.0 /100 | #26 | Exceptional 11.3% |
| Immigrants | China | 100.0 /100 | #27 | Exceptional 11.4% |
| Immigrants | Asia | 100.0 /100 | #28 | Exceptional 11.4% |
| Immigrants | Egypt | 100.0 /100 | #29 | Exceptional 11.4% |
Demographics Similar to Italians by Single Male Poverty
In terms of single male poverty, the demographic groups most similar to Italians are Senegalese (13.1%, a difference of 0.050%), Swedish (13.1%, a difference of 0.080%), Immigrants from Haiti (13.1%, a difference of 0.090%), Zimbabwean (13.1%, a difference of 0.090%), and Japanese (13.1%, a difference of 0.11%).
| Demographics | Rating | Rank | Single Male Poverty |
| Northern Europeans | 18.9 /100 | #206 | Poor 13.0% |
| Sudanese | 17.7 /100 | #207 | Poor 13.1% |
| Immigrants | Western Africa | 17.6 /100 | #208 | Poor 13.1% |
| Mexican American Indians | 17.5 /100 | #209 | Poor 13.1% |
| Immigrants | Haiti | 16.8 /100 | #210 | Poor 13.1% |
| Swedes | 16.8 /100 | #211 | Poor 13.1% |
| Senegalese | 16.4 /100 | #212 | Poor 13.1% |
| Italians | 15.9 /100 | #213 | Poor 13.1% |
| Zimbabweans | 14.9 /100 | #214 | Poor 13.1% |
| Japanese | 14.8 /100 | #215 | Poor 13.1% |
| Austrians | 13.9 /100 | #216 | Poor 13.1% |
| Bermudans | 13.0 /100 | #217 | Poor 13.1% |
| Scandinavians | 12.9 /100 | #218 | Poor 13.1% |
| Immigrants | Burma/Myanmar | 12.6 /100 | #219 | Poor 13.1% |
| Central Americans | 10.9 /100 | #220 | Poor 13.2% |