Puerto Rican vs Italian Single Male Poverty
COMPARE
Puerto Rican
Italian
Single Male Poverty
Single Male Poverty Comparison
Puerto Ricans
Italians
25.1%
SINGLE MALE POVERTY
0.0/ 100
METRIC RATING
343rd/ 347
METRIC RANK
13.1%
SINGLE MALE POVERTY
15.9/ 100
METRIC RATING
213th/ 347
METRIC RANK
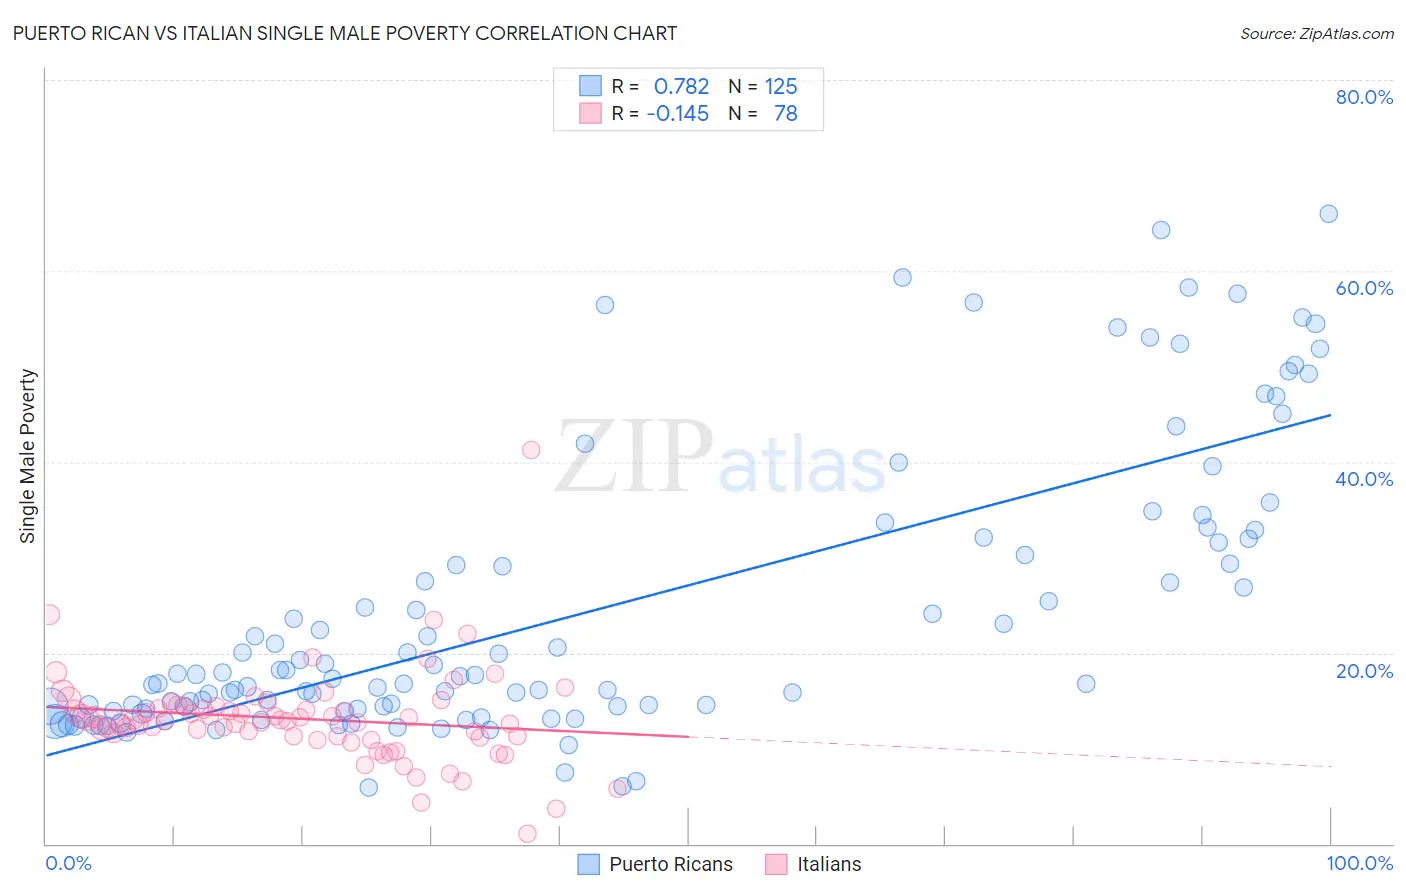
Puerto Rican vs Italian Single Male Poverty Correlation Chart
The statistical analysis conducted on geographies consisting of 451,233,514 people shows a strong positive correlation between the proportion of Puerto Ricans and poverty level among single males in the United States with a correlation coefficient (R) of 0.782 and weighted average of 25.1%. Similarly, the statistical analysis conducted on geographies consisting of 474,306,770 people shows a poor negative correlation between the proportion of Italians and poverty level among single males in the United States with a correlation coefficient (R) of -0.145 and weighted average of 13.1%, a difference of 91.7%.
Single Male Poverty Correlation Summary
| Measurement | Puerto Rican | Italian |
| Minimum | 5.9% | 1.1% |
| Maximum | 66.0% | 41.2% |
| Range | 60.0% | 40.1% |
| Mean | 24.3% | 13.1% |
| Median | 17.6% | 12.9% |
| Interquartile 25% (IQ1) | 14.2% | 11.2% |
| Interquartile 75% (IQ3) | 31.7% | 14.3% |
| Interquartile Range (IQR) | 17.6% | 3.1% |
| Standard Deviation (Sample) | 14.8% | 5.0% |
| Standard Deviation (Population) | 14.8% | 5.0% |
Similar Demographics by Single Male Poverty
Demographics Similar to Puerto Ricans by Single Male Poverty
In terms of single male poverty, the demographic groups most similar to Puerto Ricans are Lumbee (25.2%, a difference of 0.31%), Navajo (25.3%, a difference of 1.1%), Houma (23.5%, a difference of 6.9%), Crow (23.3%, a difference of 7.8%), and Hopi (27.5%, a difference of 9.7%).
| Demographics | Rating | Rank | Single Male Poverty |
| Inupiat | 0.0 /100 | #333 | Tragic 20.0% |
| Pima | 0.0 /100 | #334 | Tragic 20.2% |
| Yuman | 0.0 /100 | #335 | Tragic 21.3% |
| Tohono O'odham | 0.0 /100 | #336 | Tragic 21.6% |
| Apache | 0.0 /100 | #337 | Tragic 21.6% |
| Pueblo | 0.0 /100 | #338 | Tragic 21.6% |
| Arapaho | 0.0 /100 | #339 | Tragic 21.9% |
| Sioux | 0.0 /100 | #340 | Tragic 22.2% |
| Crow | 0.0 /100 | #341 | Tragic 23.3% |
| Houma | 0.0 /100 | #342 | Tragic 23.5% |
| Puerto Ricans | 0.0 /100 | #343 | Tragic 25.1% |
| Lumbee | 0.0 /100 | #344 | Tragic 25.2% |
| Navajo | 0.0 /100 | #345 | Tragic 25.3% |
| Hopi | 0.0 /100 | #346 | Tragic 27.5% |
| Yup'ik | 0.0 /100 | #347 | Tragic 31.6% |
Demographics Similar to Italians by Single Male Poverty
In terms of single male poverty, the demographic groups most similar to Italians are Senegalese (13.1%, a difference of 0.050%), Swedish (13.1%, a difference of 0.080%), Immigrants from Haiti (13.1%, a difference of 0.090%), Zimbabwean (13.1%, a difference of 0.090%), and Japanese (13.1%, a difference of 0.11%).
| Demographics | Rating | Rank | Single Male Poverty |
| Northern Europeans | 18.9 /100 | #206 | Poor 13.0% |
| Sudanese | 17.7 /100 | #207 | Poor 13.1% |
| Immigrants | Western Africa | 17.6 /100 | #208 | Poor 13.1% |
| Mexican American Indians | 17.5 /100 | #209 | Poor 13.1% |
| Immigrants | Haiti | 16.8 /100 | #210 | Poor 13.1% |
| Swedes | 16.8 /100 | #211 | Poor 13.1% |
| Senegalese | 16.4 /100 | #212 | Poor 13.1% |
| Italians | 15.9 /100 | #213 | Poor 13.1% |
| Zimbabweans | 14.9 /100 | #214 | Poor 13.1% |
| Japanese | 14.8 /100 | #215 | Poor 13.1% |
| Austrians | 13.9 /100 | #216 | Poor 13.1% |
| Bermudans | 13.0 /100 | #217 | Poor 13.1% |
| Scandinavians | 12.9 /100 | #218 | Poor 13.1% |
| Immigrants | Burma/Myanmar | 12.6 /100 | #219 | Poor 13.1% |
| Central Americans | 10.9 /100 | #220 | Poor 13.2% |