Yugoslavian vs Armenian Single Female Poverty
COMPARE
Yugoslavian
Armenian
Single Female Poverty
Single Female Poverty Comparison
Yugoslavians
Armenians
21.2%
SINGLE FEMALE POVERTY
35.4/ 100
METRIC RATING
188th/ 347
METRIC RANK
18.3%
SINGLE FEMALE POVERTY
100.0/ 100
METRIC RATING
24th/ 347
METRIC RANK
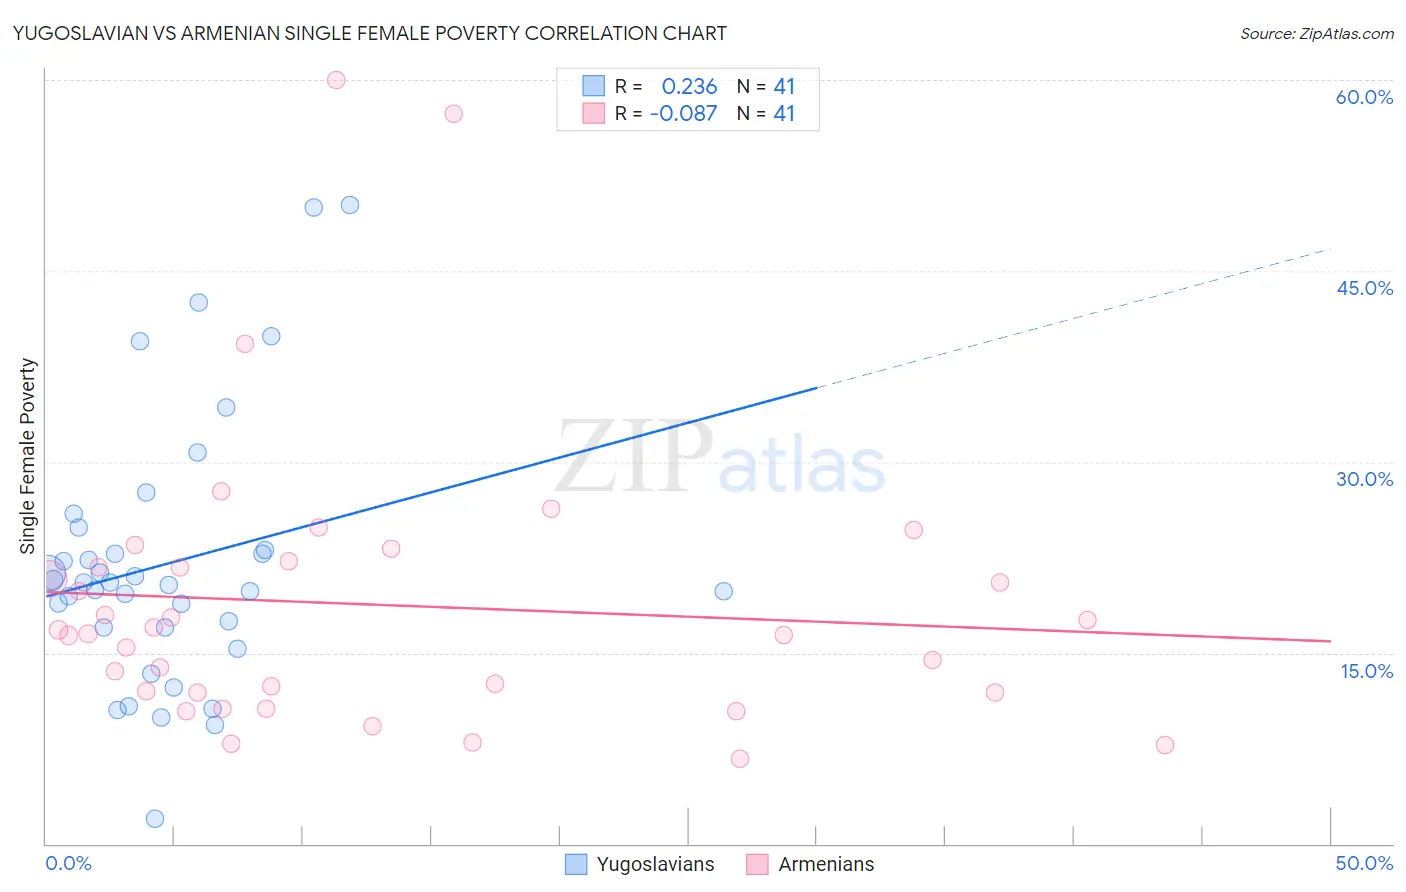
Yugoslavian vs Armenian Single Female Poverty Correlation Chart
The statistical analysis conducted on geographies consisting of 282,795,313 people shows a weak positive correlation between the proportion of Yugoslavians and poverty level among single females in the United States with a correlation coefficient (R) of 0.236 and weighted average of 21.2%. Similarly, the statistical analysis conducted on geographies consisting of 305,765,462 people shows a slight negative correlation between the proportion of Armenians and poverty level among single females in the United States with a correlation coefficient (R) of -0.087 and weighted average of 18.3%, a difference of 15.7%.
Single Female Poverty Correlation Summary
| Measurement | Yugoslavian | Armenian |
| Minimum | 2.0% | 6.7% |
| Maximum | 50.2% | 60.0% |
| Range | 48.2% | 53.3% |
| Mean | 22.1% | 18.8% |
| Median | 20.5% | 16.5% |
| Interquartile 25% (IQ1) | 17.0% | 11.9% |
| Interquartile 75% (IQ3) | 23.9% | 21.9% |
| Interquartile Range (IQR) | 7.0% | 10.1% |
| Standard Deviation (Sample) | 10.4% | 11.3% |
| Standard Deviation (Population) | 10.3% | 11.1% |
Similar Demographics by Single Female Poverty
Demographics Similar to Yugoslavians by Single Female Poverty
In terms of single female poverty, the demographic groups most similar to Yugoslavians are Immigrants from Cuba (21.2%, a difference of 0.010%), Trinidadian and Tobagonian (21.2%, a difference of 0.010%), Immigrants from Nigeria (21.2%, a difference of 0.090%), Hawaiian (21.2%, a difference of 0.15%), and Immigrants from Cambodia (21.2%, a difference of 0.19%).
| Demographics | Rating | Rank | Single Female Poverty |
| Europeans | 42.3 /100 | #181 | Average 21.1% |
| Slavs | 40.5 /100 | #182 | Average 21.1% |
| Slovaks | 39.7 /100 | #183 | Fair 21.1% |
| Hungarians | 39.6 /100 | #184 | Fair 21.1% |
| Immigrants | Cambodia | 38.2 /100 | #185 | Fair 21.2% |
| Hawaiians | 37.7 /100 | #186 | Fair 21.2% |
| Immigrants | Nigeria | 36.8 /100 | #187 | Fair 21.2% |
| Yugoslavians | 35.4 /100 | #188 | Fair 21.2% |
| Immigrants | Cuba | 35.3 /100 | #189 | Fair 21.2% |
| Trinidadians and Tobagonians | 35.2 /100 | #190 | Fair 21.2% |
| Immigrants | Germany | 31.1 /100 | #191 | Fair 21.3% |
| Immigrants | Jamaica | 30.5 /100 | #192 | Fair 21.3% |
| Basques | 28.1 /100 | #193 | Fair 21.3% |
| Czechoslovakians | 27.7 /100 | #194 | Fair 21.3% |
| Nicaraguans | 27.6 /100 | #195 | Fair 21.3% |
Demographics Similar to Armenians by Single Female Poverty
In terms of single female poverty, the demographic groups most similar to Armenians are Immigrants from Singapore (18.3%, a difference of 0.10%), Immigrants from Israel (18.3%, a difference of 0.12%), Burmese (18.3%, a difference of 0.23%), Asian (18.3%, a difference of 0.23%), and Maltese (18.3%, a difference of 0.24%).
| Demographics | Rating | Rank | Single Female Poverty |
| Immigrants | Korea | 100.0 /100 | #17 | Exceptional 18.1% |
| Immigrants | Eastern Asia | 100.0 /100 | #18 | Exceptional 18.1% |
| Immigrants | China | 100.0 /100 | #19 | Exceptional 18.1% |
| Immigrants | Greece | 100.0 /100 | #20 | Exceptional 18.3% |
| Maltese | 100.0 /100 | #21 | Exceptional 18.3% |
| Burmese | 100.0 /100 | #22 | Exceptional 18.3% |
| Asians | 100.0 /100 | #23 | Exceptional 18.3% |
| Armenians | 100.0 /100 | #24 | Exceptional 18.3% |
| Immigrants | Singapore | 100.0 /100 | #25 | Exceptional 18.3% |
| Immigrants | Israel | 100.0 /100 | #26 | Exceptional 18.3% |
| Immigrants | Pakistan | 100.0 /100 | #27 | Exceptional 18.4% |
| Immigrants | Moldova | 100.0 /100 | #28 | Exceptional 18.5% |
| Immigrants | Poland | 100.0 /100 | #29 | Exceptional 18.5% |
| Immigrants | North Macedonia | 99.9 /100 | #30 | Exceptional 18.5% |
| Immigrants | Asia | 99.9 /100 | #31 | Exceptional 18.6% |