Cajun vs Immigrants from Trinidad and Tobago Single Father Poverty
COMPARE
Cajun
Immigrants from Trinidad and Tobago
Single Father Poverty
Single Father Poverty Comparison
Cajuns
Immigrants from Trinidad and Tobago
23.1%
SINGLE FATHER POVERTY
0.0/ 100
METRIC RATING
336th/ 347
METRIC RANK
16.8%
SINGLE FATHER POVERTY
4.5/ 100
METRIC RATING
230th/ 347
METRIC RANK
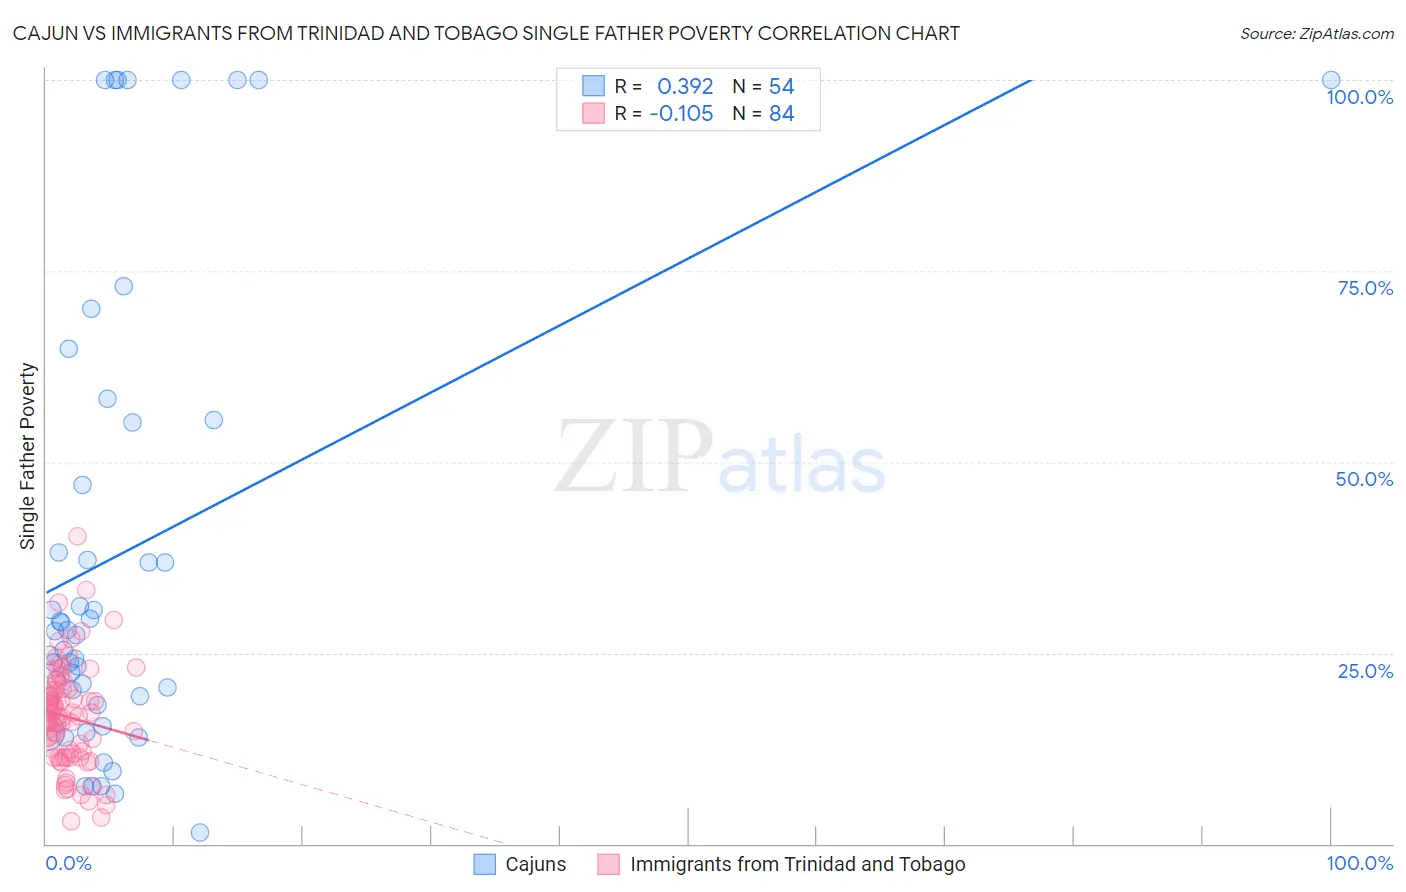
Cajun vs Immigrants from Trinidad and Tobago Single Father Poverty Correlation Chart
The statistical analysis conducted on geographies consisting of 130,032,102 people shows a mild positive correlation between the proportion of Cajuns and poverty level among single fathers in the United States with a correlation coefficient (R) of 0.392 and weighted average of 23.1%. Similarly, the statistical analysis conducted on geographies consisting of 189,683,787 people shows a poor negative correlation between the proportion of Immigrants from Trinidad and Tobago and poverty level among single fathers in the United States with a correlation coefficient (R) of -0.105 and weighted average of 16.8%, a difference of 37.0%.
Single Father Poverty Correlation Summary
| Measurement | Cajun | Immigrants from Trinidad and Tobago |
| Minimum | 1.4% | 3.0% |
| Maximum | 100.0% | 40.2% |
| Range | 98.6% | 37.3% |
| Mean | 38.2% | 16.6% |
| Median | 27.6% | 16.7% |
| Interquartile 25% (IQ1) | 18.4% | 11.4% |
| Interquartile 75% (IQ3) | 55.1% | 20.2% |
| Interquartile Range (IQR) | 36.7% | 8.9% |
| Standard Deviation (Sample) | 30.3% | 6.8% |
| Standard Deviation (Population) | 30.0% | 6.8% |
Similar Demographics by Single Father Poverty
Demographics Similar to Cajuns by Single Father Poverty
In terms of single father poverty, the demographic groups most similar to Cajuns are Shoshone (22.9%, a difference of 0.71%), Kiowa (22.5%, a difference of 2.7%), Native/Alaskan (22.4%, a difference of 3.0%), Sioux (23.9%, a difference of 3.5%), and Arapaho (24.0%, a difference of 3.9%).
| Demographics | Rating | Rank | Single Father Poverty |
| Colville | 0.0 /100 | #329 | Tragic 21.4% |
| Paiute | 0.0 /100 | #330 | Tragic 21.6% |
| Central American Indians | 0.0 /100 | #331 | Tragic 21.7% |
| Tohono O'odham | 0.0 /100 | #332 | Tragic 22.0% |
| Natives/Alaskans | 0.0 /100 | #333 | Tragic 22.4% |
| Kiowa | 0.0 /100 | #334 | Tragic 22.5% |
| Shoshone | 0.0 /100 | #335 | Tragic 22.9% |
| Cajuns | 0.0 /100 | #336 | Tragic 23.1% |
| Sioux | 0.0 /100 | #337 | Tragic 23.9% |
| Arapaho | 0.0 /100 | #338 | Tragic 24.0% |
| Apache | 0.0 /100 | #339 | Tragic 24.2% |
| Houma | 0.0 /100 | #340 | Tragic 26.7% |
| Hopi | 0.0 /100 | #341 | Tragic 27.2% |
| Yuman | 0.0 /100 | #342 | Tragic 28.4% |
| Lumbee | 0.0 /100 | #343 | Tragic 28.5% |
Demographics Similar to Immigrants from Trinidad and Tobago by Single Father Poverty
In terms of single father poverty, the demographic groups most similar to Immigrants from Trinidad and Tobago are Israeli (16.8%, a difference of 0.030%), Belgian (16.8%, a difference of 0.19%), Spanish American (16.9%, a difference of 0.21%), Immigrants from Grenada (16.9%, a difference of 0.23%), and British (16.8%, a difference of 0.26%).
| Demographics | Rating | Rank | Single Father Poverty |
| Immigrants | Austria | 7.0 /100 | #223 | Tragic 16.8% |
| Immigrants | Norway | 6.5 /100 | #224 | Tragic 16.8% |
| Menominee | 6.4 /100 | #225 | Tragic 16.8% |
| Hispanics or Latinos | 6.1 /100 | #226 | Tragic 16.8% |
| British | 5.6 /100 | #227 | Tragic 16.8% |
| Belgians | 5.3 /100 | #228 | Tragic 16.8% |
| Israelis | 4.6 /100 | #229 | Tragic 16.8% |
| Immigrants | Trinidad and Tobago | 4.5 /100 | #230 | Tragic 16.8% |
| Spanish Americans | 3.7 /100 | #231 | Tragic 16.9% |
| Immigrants | Grenada | 3.7 /100 | #232 | Tragic 16.9% |
| Senegalese | 3.2 /100 | #233 | Tragic 16.9% |
| Marshallese | 3.1 /100 | #234 | Tragic 16.9% |
| Immigrants | Western Europe | 2.9 /100 | #235 | Tragic 16.9% |
| Immigrants | Germany | 2.9 /100 | #236 | Tragic 16.9% |
| Sub-Saharan Africans | 2.9 /100 | #237 | Tragic 16.9% |