Cajun vs Immigrants from Micronesia Single Mother Poverty
COMPARE
Cajun
Immigrants from Micronesia
Single Mother Poverty
Single Mother Poverty Comparison
Cajuns
Immigrants from Micronesia
40.3%
SINGLE MOTHER POVERTY
0.0/ 100
METRIC RATING
343rd/ 347
METRIC RANK
31.6%
SINGLE MOTHER POVERTY
0.1/ 100
METRIC RATING
272nd/ 347
METRIC RANK
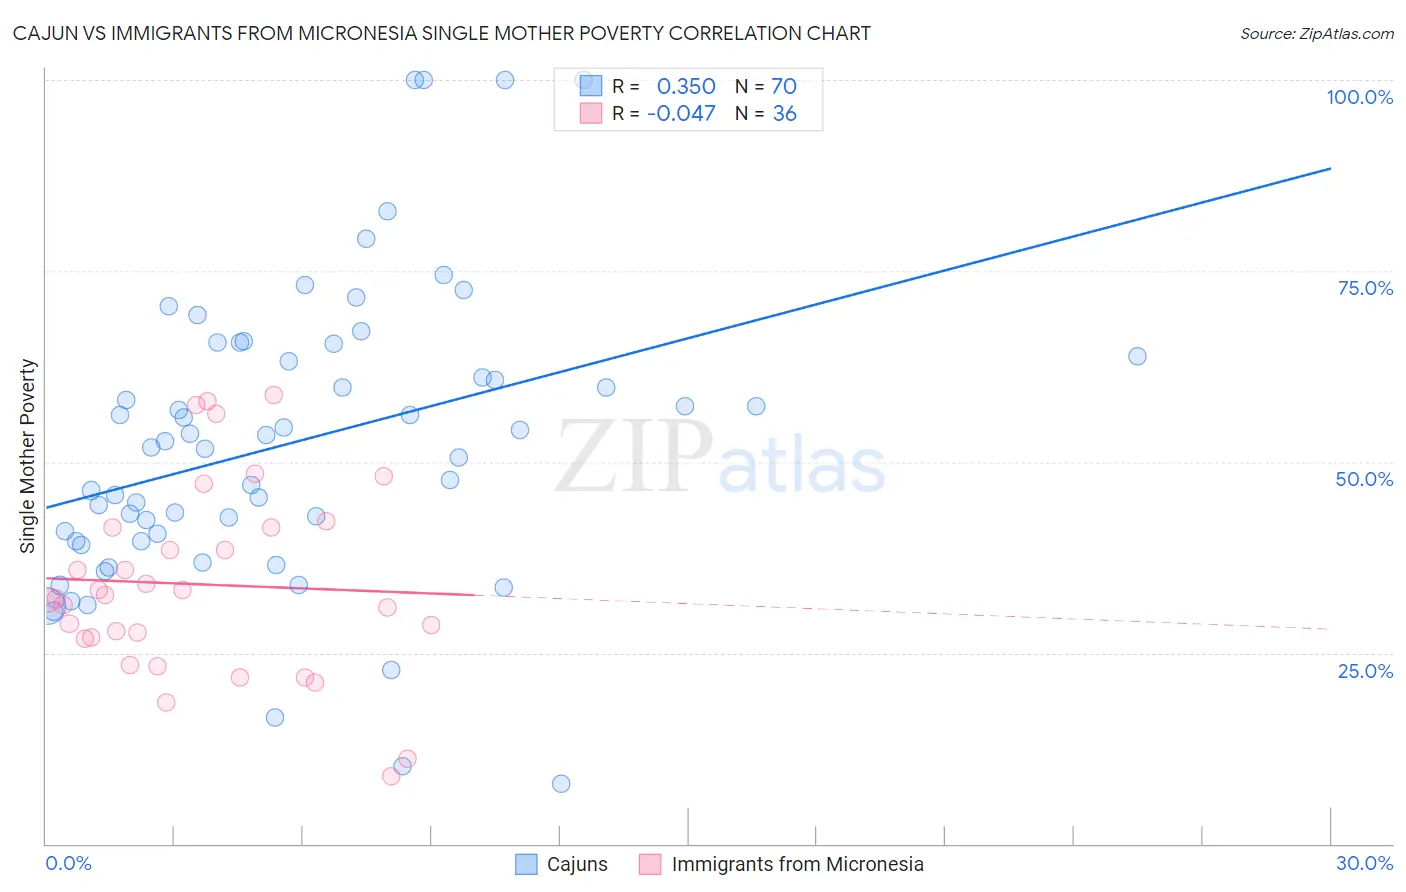
Cajun vs Immigrants from Micronesia Single Mother Poverty Correlation Chart
The statistical analysis conducted on geographies consisting of 148,029,233 people shows a mild positive correlation between the proportion of Cajuns and poverty level among single mothers in the United States with a correlation coefficient (R) of 0.350 and weighted average of 40.3%. Similarly, the statistical analysis conducted on geographies consisting of 61,413,620 people shows no correlation between the proportion of Immigrants from Micronesia and poverty level among single mothers in the United States with a correlation coefficient (R) of -0.047 and weighted average of 31.6%, a difference of 27.8%.
Single Mother Poverty Correlation Summary
| Measurement | Cajun | Immigrants from Micronesia |
| Minimum | 7.8% | 8.8% |
| Maximum | 100.0% | 58.8% |
| Range | 92.2% | 50.0% |
| Mean | 52.5% | 34.0% |
| Median | 52.2% | 32.3% |
| Interquartile 25% (IQ1) | 39.6% | 26.9% |
| Interquartile 75% (IQ3) | 63.8% | 41.3% |
| Interquartile Range (IQR) | 24.2% | 14.5% |
| Standard Deviation (Sample) | 19.4% | 12.4% |
| Standard Deviation (Population) | 19.3% | 12.2% |
Similar Demographics by Single Mother Poverty
Demographics Similar to Cajuns by Single Mother Poverty
In terms of single mother poverty, the demographic groups most similar to Cajuns are Navajo (40.2%, a difference of 0.33%), Colville (39.3%, a difference of 2.7%), Sioux (38.8%, a difference of 4.0%), Crow (38.6%, a difference of 4.4%), and Pima (38.6%, a difference of 4.5%).
| Demographics | Rating | Rank | Single Mother Poverty |
| Menominee | 0.0 /100 | #333 | Tragic 37.1% |
| Pueblo | 0.0 /100 | #334 | Tragic 37.2% |
| Yuman | 0.0 /100 | #335 | Tragic 37.8% |
| Cheyenne | 0.0 /100 | #336 | Tragic 38.5% |
| Immigrants | Yemen | 0.0 /100 | #337 | Tragic 38.5% |
| Pima | 0.0 /100 | #338 | Tragic 38.6% |
| Crow | 0.0 /100 | #339 | Tragic 38.6% |
| Sioux | 0.0 /100 | #340 | Tragic 38.8% |
| Colville | 0.0 /100 | #341 | Tragic 39.3% |
| Navajo | 0.0 /100 | #342 | Tragic 40.2% |
| Cajuns | 0.0 /100 | #343 | Tragic 40.3% |
| Tohono O'odham | 0.0 /100 | #344 | Tragic 43.0% |
| Lumbee | 0.0 /100 | #345 | Tragic 43.2% |
| Houma | 0.0 /100 | #346 | Tragic 43.5% |
| Puerto Ricans | 0.0 /100 | #347 | Tragic 44.5% |
Demographics Similar to Immigrants from Micronesia by Single Mother Poverty
In terms of single mother poverty, the demographic groups most similar to Immigrants from Micronesia are Immigrants from Cabo Verde (31.6%, a difference of 0.010%), Fijian (31.6%, a difference of 0.23%), British West Indian (31.5%, a difference of 0.26%), Scotch-Irish (31.5%, a difference of 0.30%), and Immigrants from Senegal (31.5%, a difference of 0.35%).
| Demographics | Rating | Rank | Single Mother Poverty |
| German Russians | 0.2 /100 | #265 | Tragic 31.3% |
| Sub-Saharan Africans | 0.2 /100 | #266 | Tragic 31.4% |
| Immigrants | Belize | 0.2 /100 | #267 | Tragic 31.4% |
| Immigrants | Senegal | 0.1 /100 | #268 | Tragic 31.5% |
| Scotch-Irish | 0.1 /100 | #269 | Tragic 31.5% |
| British West Indians | 0.1 /100 | #270 | Tragic 31.5% |
| Immigrants | Cabo Verde | 0.1 /100 | #271 | Tragic 31.6% |
| Immigrants | Micronesia | 0.1 /100 | #272 | Tragic 31.6% |
| Fijians | 0.1 /100 | #273 | Tragic 31.6% |
| Bangladeshis | 0.1 /100 | #274 | Tragic 31.7% |
| Central Americans | 0.1 /100 | #275 | Tragic 31.8% |
| Delaware | 0.0 /100 | #276 | Tragic 31.8% |
| Mexican American Indians | 0.0 /100 | #277 | Tragic 31.9% |
| Immigrants | Zaire | 0.0 /100 | #278 | Tragic 32.0% |
| Marshallese | 0.0 /100 | #279 | Tragic 32.1% |