Cajun vs Alaska Native Single Father Households
COMPARE
Cajun
Alaska Native
Single Father Households
Single Father Households Comparison
Cajuns
Alaska Natives
2.5%
SINGLE FATHER HOUSEHOLDS
6.1/ 100
METRIC RATING
236th/ 347
METRIC RANK
3.5%
SINGLE FATHER HOUSEHOLDS
0.0/ 100
METRIC RATING
340th/ 347
METRIC RANK
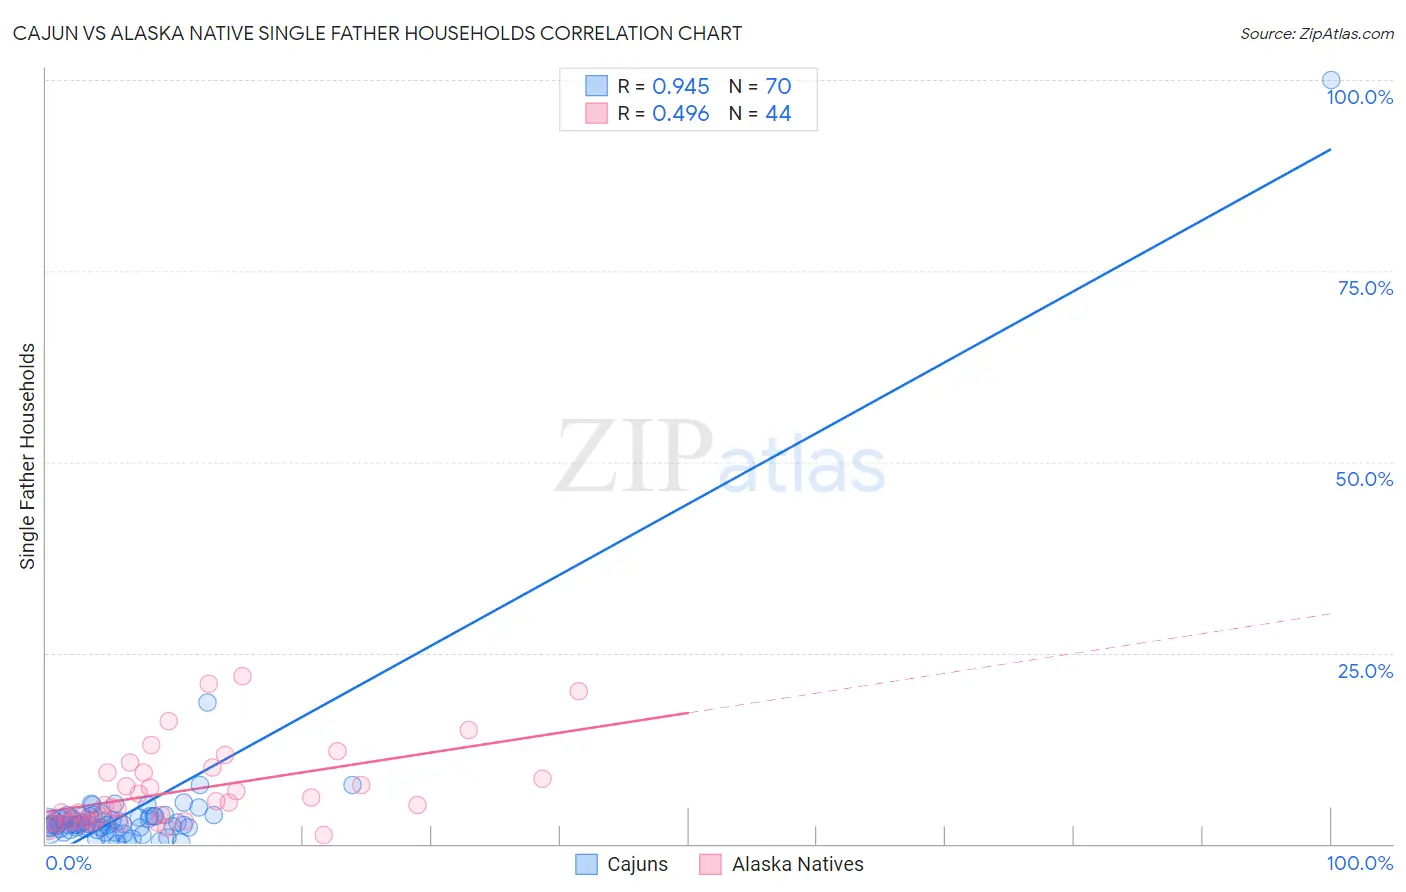
Cajun vs Alaska Native Single Father Households Correlation Chart
The statistical analysis conducted on geographies consisting of 148,931,799 people shows a near-perfect positive correlation between the proportion of Cajuns and percentage of single father households in the United States with a correlation coefficient (R) of 0.945 and weighted average of 2.5%. Similarly, the statistical analysis conducted on geographies consisting of 76,608,440 people shows a moderate positive correlation between the proportion of Alaska Natives and percentage of single father households in the United States with a correlation coefficient (R) of 0.496 and weighted average of 3.5%, a difference of 42.6%.
Single Father Households Correlation Summary
| Measurement | Cajun | Alaska Native |
| Minimum | 0.066% | 1.1% |
| Maximum | 100.0% | 21.9% |
| Range | 99.9% | 20.8% |
| Mean | 4.4% | 7.0% |
| Median | 2.6% | 5.1% |
| Interquartile 25% (IQ1) | 2.1% | 2.9% |
| Interquartile 75% (IQ3) | 3.6% | 9.4% |
| Interquartile Range (IQR) | 1.5% | 6.5% |
| Standard Deviation (Sample) | 11.8% | 5.3% |
| Standard Deviation (Population) | 11.8% | 5.2% |
Similar Demographics by Single Father Households
Demographics Similar to Cajuns by Single Father Households
In terms of single father households, the demographic groups most similar to Cajuns are Immigrants (2.5%, a difference of 0.050%), Sierra Leonean (2.5%, a difference of 0.050%), African (2.5%, a difference of 0.070%), Immigrants from Sierra Leone (2.5%, a difference of 0.080%), and Immigrants from Oceania (2.5%, a difference of 0.090%).
| Demographics | Rating | Rank | Single Father Households |
| Immigrants | Zaire | 8.6 /100 | #229 | Tragic 2.4% |
| Sub-Saharan Africans | 8.3 /100 | #230 | Tragic 2.4% |
| Immigrants | Nonimmigrants | 7.6 /100 | #231 | Tragic 2.4% |
| Pennsylvania Germans | 7.3 /100 | #232 | Tragic 2.4% |
| Immigrants | Western Africa | 7.0 /100 | #233 | Tragic 2.4% |
| Africans | 6.3 /100 | #234 | Tragic 2.5% |
| Immigrants | Immigrants | 6.3 /100 | #235 | Tragic 2.5% |
| Cajuns | 6.1 /100 | #236 | Tragic 2.5% |
| Sierra Leoneans | 5.9 /100 | #237 | Tragic 2.5% |
| Immigrants | Sierra Leone | 5.8 /100 | #238 | Tragic 2.5% |
| Immigrants | Oceania | 5.8 /100 | #239 | Tragic 2.5% |
| Immigrants | Dominica | 4.8 /100 | #240 | Tragic 2.5% |
| Portuguese | 4.1 /100 | #241 | Tragic 2.5% |
| Osage | 4.1 /100 | #242 | Tragic 2.5% |
| Spaniards | 3.1 /100 | #243 | Tragic 2.5% |
Demographics Similar to Alaska Natives by Single Father Households
In terms of single father households, the demographic groups most similar to Alaska Natives are Crow (3.5%, a difference of 0.35%), Alaskan Athabascan (3.4%, a difference of 3.8%), Sioux (3.3%, a difference of 5.3%), Pueblo (3.3%, a difference of 6.0%), and Paiute (3.3%, a difference of 6.2%).
| Demographics | Rating | Rank | Single Father Households |
| Natives/Alaskans | 0.0 /100 | #333 | Tragic 3.2% |
| Yuman | 0.0 /100 | #334 | Tragic 3.3% |
| Colville | 0.0 /100 | #335 | Tragic 3.3% |
| Paiute | 0.0 /100 | #336 | Tragic 3.3% |
| Pueblo | 0.0 /100 | #337 | Tragic 3.3% |
| Sioux | 0.0 /100 | #338 | Tragic 3.3% |
| Alaskan Athabascans | 0.0 /100 | #339 | Tragic 3.4% |
| Alaska Natives | 0.0 /100 | #340 | Tragic 3.5% |
| Crow | 0.0 /100 | #341 | Tragic 3.5% |
| Tohono O'odham | 0.0 /100 | #342 | Tragic 3.8% |
| Pima | 0.0 /100 | #343 | Tragic 4.2% |
| Yakama | 0.0 /100 | #344 | Tragic 4.2% |
| Menominee | 0.0 /100 | #345 | Tragic 4.2% |
| Inupiat | 0.0 /100 | #346 | Tragic 4.9% |
| Yup'ik | 0.0 /100 | #347 | Tragic 5.4% |