Brazilian vs Immigrants from Uzbekistan Single Mother Poverty
COMPARE
Brazilian
Immigrants from Uzbekistan
Single Mother Poverty
Single Mother Poverty Comparison
Brazilians
Immigrants from Uzbekistan
28.3%
SINGLE MOTHER POVERTY
92.4/ 100
METRIC RATING
118th/ 347
METRIC RANK
29.3%
SINGLE MOTHER POVERTY
42.6/ 100
METRIC RATING
179th/ 347
METRIC RANK
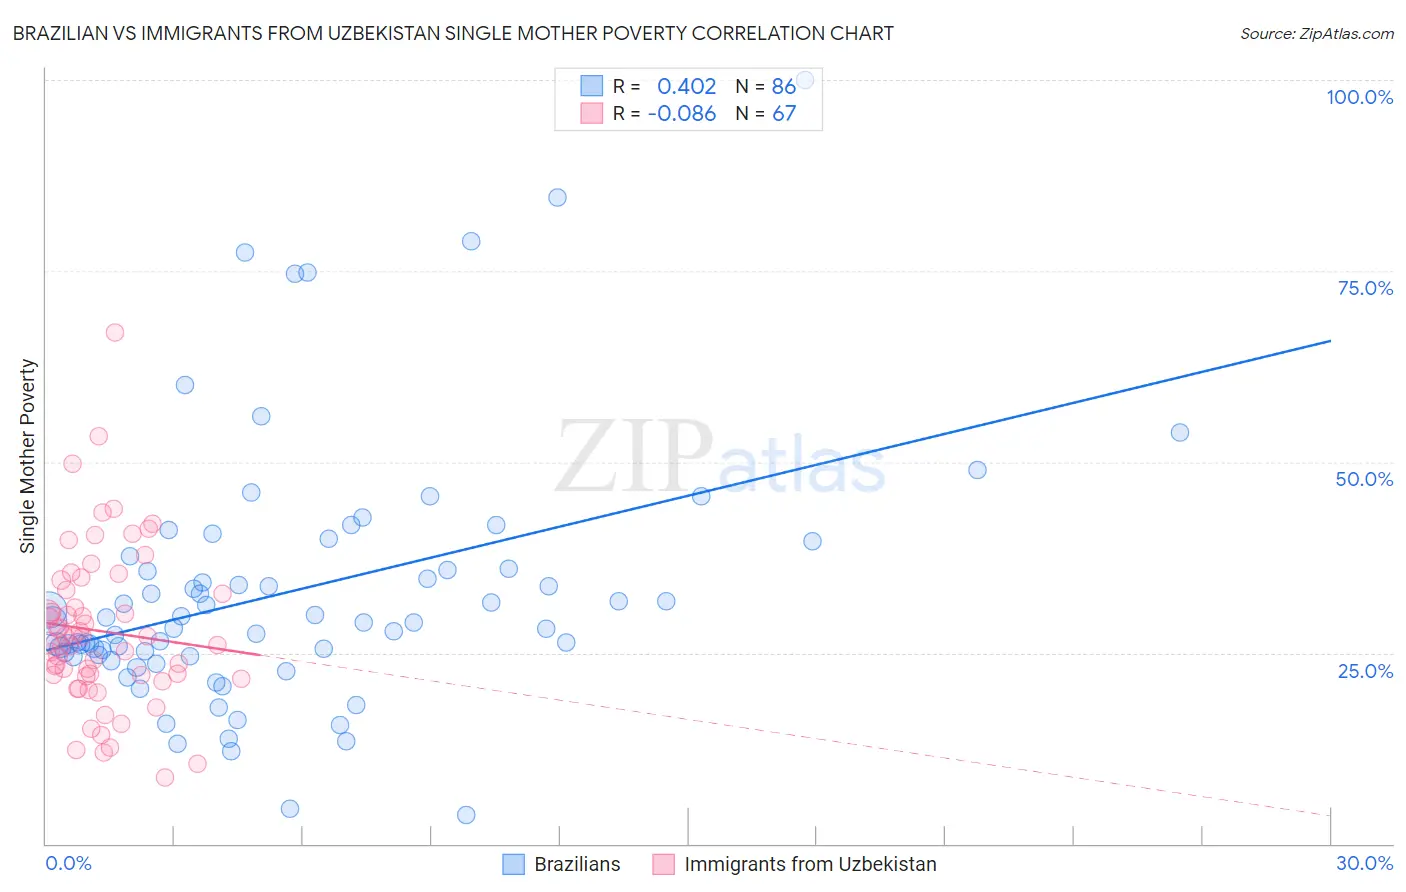
Brazilian vs Immigrants from Uzbekistan Single Mother Poverty Correlation Chart
The statistical analysis conducted on geographies consisting of 317,046,418 people shows a moderate positive correlation between the proportion of Brazilians and poverty level among single mothers in the United States with a correlation coefficient (R) of 0.402 and weighted average of 28.3%. Similarly, the statistical analysis conducted on geographies consisting of 117,476,483 people shows a slight negative correlation between the proportion of Immigrants from Uzbekistan and poverty level among single mothers in the United States with a correlation coefficient (R) of -0.086 and weighted average of 29.3%, a difference of 3.5%.
Single Mother Poverty Correlation Summary
| Measurement | Brazilian | Immigrants from Uzbekistan |
| Minimum | 3.8% | 8.7% |
| Maximum | 100.0% | 67.0% |
| Range | 96.2% | 58.3% |
| Mean | 33.0% | 27.8% |
| Median | 29.0% | 26.3% |
| Interquartile 25% (IQ1) | 24.7% | 21.9% |
| Interquartile 75% (IQ3) | 36.1% | 33.2% |
| Interquartile Range (IQR) | 11.4% | 11.3% |
| Standard Deviation (Sample) | 16.9% | 10.5% |
| Standard Deviation (Population) | 16.8% | 10.4% |
Similar Demographics by Single Mother Poverty
Demographics Similar to Brazilians by Single Mother Poverty
In terms of single mother poverty, the demographic groups most similar to Brazilians are Australian (28.3%, a difference of 0.010%), Immigrants from Syria (28.3%, a difference of 0.010%), Immigrants from Uganda (28.3%, a difference of 0.020%), Cypriot (28.3%, a difference of 0.030%), and Immigrants from Kuwait (28.3%, a difference of 0.040%).
| Demographics | Rating | Rank | Single Mother Poverty |
| Venezuelans | 94.5 /100 | #111 | Exceptional 28.2% |
| Immigrants | Kazakhstan | 94.5 /100 | #112 | Exceptional 28.2% |
| Immigrants | South Africa | 93.2 /100 | #113 | Exceptional 28.3% |
| Immigrants | Western Asia | 92.7 /100 | #114 | Exceptional 28.3% |
| Immigrants | Kuwait | 92.7 /100 | #115 | Exceptional 28.3% |
| Immigrants | Uganda | 92.5 /100 | #116 | Exceptional 28.3% |
| Australians | 92.5 /100 | #117 | Exceptional 28.3% |
| Brazilians | 92.4 /100 | #118 | Exceptional 28.3% |
| Immigrants | Syria | 92.4 /100 | #119 | Exceptional 28.3% |
| Cypriots | 92.3 /100 | #120 | Exceptional 28.3% |
| Immigrants | Afghanistan | 92.1 /100 | #121 | Exceptional 28.3% |
| Colombians | 91.8 /100 | #122 | Exceptional 28.3% |
| Uruguayans | 91.7 /100 | #123 | Exceptional 28.3% |
| Immigrants | Switzerland | 91.7 /100 | #124 | Exceptional 28.3% |
| Kenyans | 90.9 /100 | #125 | Exceptional 28.4% |
Demographics Similar to Immigrants from Uzbekistan by Single Mother Poverty
In terms of single mother poverty, the demographic groups most similar to Immigrants from Uzbekistan are South American Indian (29.3%, a difference of 0.030%), Immigrants from Norway (29.3%, a difference of 0.050%), Canadian (29.3%, a difference of 0.11%), Immigrants from Bosnia and Herzegovina (29.2%, a difference of 0.12%), and Immigrants from Eastern Africa (29.3%, a difference of 0.20%).
| Demographics | Rating | Rank | Single Mother Poverty |
| Carpatho Rusyns | 53.8 /100 | #172 | Average 29.1% |
| British | 50.6 /100 | #173 | Average 29.2% |
| Immigrants | Saudi Arabia | 50.0 /100 | #174 | Average 29.2% |
| Immigrants | Costa Rica | 48.8 /100 | #175 | Average 29.2% |
| Hawaiians | 47.8 /100 | #176 | Average 29.2% |
| Immigrants | Bosnia and Herzegovina | 45.1 /100 | #177 | Average 29.2% |
| South American Indians | 43.2 /100 | #178 | Average 29.3% |
| Immigrants | Uzbekistan | 42.6 /100 | #179 | Average 29.3% |
| Immigrants | Norway | 41.5 /100 | #180 | Average 29.3% |
| Canadians | 40.4 /100 | #181 | Average 29.3% |
| Immigrants | Eastern Africa | 38.5 /100 | #182 | Fair 29.3% |
| Nepalese | 38.3 /100 | #183 | Fair 29.3% |
| Nigerians | 38.0 /100 | #184 | Fair 29.3% |
| Ghanaians | 36.8 /100 | #185 | Fair 29.4% |
| Yugoslavians | 36.0 /100 | #186 | Fair 29.4% |