Brazilian vs Immigrants from Italy Single Mother Poverty
COMPARE
Brazilian
Immigrants from Italy
Single Mother Poverty
Single Mother Poverty Comparison
Brazilians
Immigrants from Italy
28.3%
SINGLE MOTHER POVERTY
92.4/ 100
METRIC RATING
118th/ 347
METRIC RANK
27.5%
SINGLE MOTHER POVERTY
99.1/ 100
METRIC RATING
79th/ 347
METRIC RANK
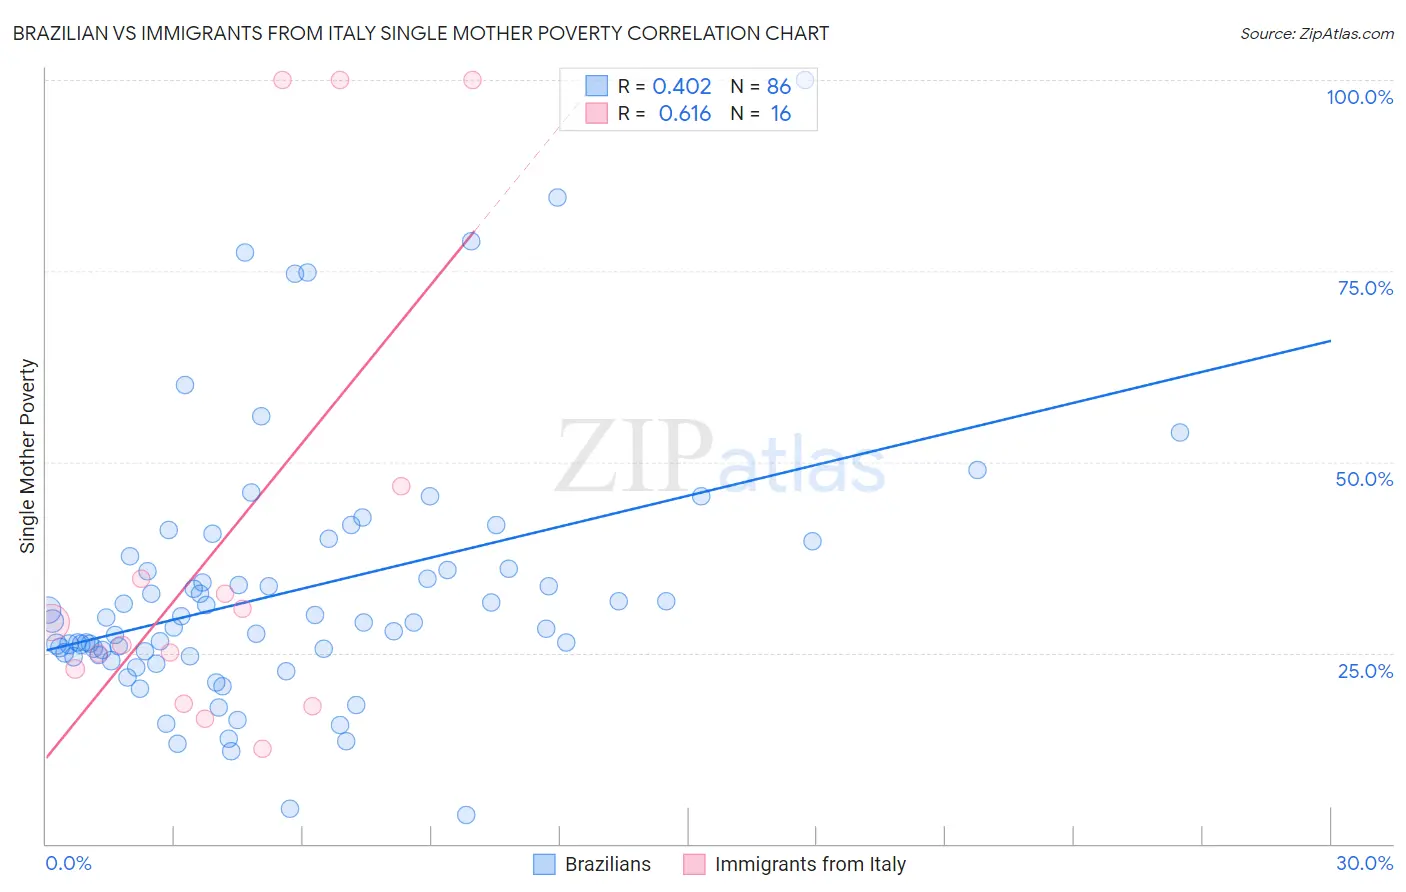
Brazilian vs Immigrants from Italy Single Mother Poverty Correlation Chart
The statistical analysis conducted on geographies consisting of 317,046,418 people shows a moderate positive correlation between the proportion of Brazilians and poverty level among single mothers in the United States with a correlation coefficient (R) of 0.402 and weighted average of 28.3%. Similarly, the statistical analysis conducted on geographies consisting of 315,189,734 people shows a significant positive correlation between the proportion of Immigrants from Italy and poverty level among single mothers in the United States with a correlation coefficient (R) of 0.616 and weighted average of 27.5%, a difference of 2.8%.
Single Mother Poverty Correlation Summary
| Measurement | Brazilian | Immigrants from Italy |
| Minimum | 3.8% | 12.5% |
| Maximum | 100.0% | 100.0% |
| Range | 96.2% | 87.5% |
| Mean | 33.0% | 39.9% |
| Median | 29.0% | 27.5% |
| Interquartile 25% (IQ1) | 24.7% | 20.6% |
| Interquartile 75% (IQ3) | 36.1% | 40.7% |
| Interquartile Range (IQR) | 11.4% | 20.1% |
| Standard Deviation (Sample) | 16.9% | 30.9% |
| Standard Deviation (Population) | 16.8% | 29.9% |
Similar Demographics by Single Mother Poverty
Demographics Similar to Brazilians by Single Mother Poverty
In terms of single mother poverty, the demographic groups most similar to Brazilians are Australian (28.3%, a difference of 0.010%), Immigrants from Syria (28.3%, a difference of 0.010%), Immigrants from Uganda (28.3%, a difference of 0.020%), Cypriot (28.3%, a difference of 0.030%), and Immigrants from Kuwait (28.3%, a difference of 0.040%).
| Demographics | Rating | Rank | Single Mother Poverty |
| Venezuelans | 94.5 /100 | #111 | Exceptional 28.2% |
| Immigrants | Kazakhstan | 94.5 /100 | #112 | Exceptional 28.2% |
| Immigrants | South Africa | 93.2 /100 | #113 | Exceptional 28.3% |
| Immigrants | Western Asia | 92.7 /100 | #114 | Exceptional 28.3% |
| Immigrants | Kuwait | 92.7 /100 | #115 | Exceptional 28.3% |
| Immigrants | Uganda | 92.5 /100 | #116 | Exceptional 28.3% |
| Australians | 92.5 /100 | #117 | Exceptional 28.3% |
| Brazilians | 92.4 /100 | #118 | Exceptional 28.3% |
| Immigrants | Syria | 92.4 /100 | #119 | Exceptional 28.3% |
| Cypriots | 92.3 /100 | #120 | Exceptional 28.3% |
| Immigrants | Afghanistan | 92.1 /100 | #121 | Exceptional 28.3% |
| Colombians | 91.8 /100 | #122 | Exceptional 28.3% |
| Uruguayans | 91.7 /100 | #123 | Exceptional 28.3% |
| Immigrants | Switzerland | 91.7 /100 | #124 | Exceptional 28.3% |
| Kenyans | 90.9 /100 | #125 | Exceptional 28.4% |
Demographics Similar to Immigrants from Italy by Single Mother Poverty
In terms of single mother poverty, the demographic groups most similar to Immigrants from Italy are Taiwanese (27.5%, a difference of 0.0%), Immigrants from North Macedonia (27.5%, a difference of 0.030%), Immigrants from Peru (27.5%, a difference of 0.050%), Peruvian (27.5%, a difference of 0.070%), and Immigrants from Sweden (27.5%, a difference of 0.11%).
| Demographics | Rating | Rank | Single Mother Poverty |
| Immigrants | Russia | 99.4 /100 | #72 | Exceptional 27.4% |
| Sierra Leoneans | 99.3 /100 | #73 | Exceptional 27.4% |
| Immigrants | Europe | 99.3 /100 | #74 | Exceptional 27.4% |
| Immigrants | Sweden | 99.2 /100 | #75 | Exceptional 27.5% |
| Peruvians | 99.2 /100 | #76 | Exceptional 27.5% |
| Immigrants | Peru | 99.2 /100 | #77 | Exceptional 27.5% |
| Immigrants | North Macedonia | 99.2 /100 | #78 | Exceptional 27.5% |
| Immigrants | Italy | 99.1 /100 | #79 | Exceptional 27.5% |
| Taiwanese | 99.1 /100 | #80 | Exceptional 27.5% |
| Immigrants | Scotland | 98.9 /100 | #81 | Exceptional 27.6% |
| Immigrants | Cameroon | 98.8 /100 | #82 | Exceptional 27.6% |
| Greeks | 98.7 /100 | #83 | Exceptional 27.7% |
| Immigrants | Latvia | 98.7 /100 | #84 | Exceptional 27.7% |
| Mongolians | 98.7 /100 | #85 | Exceptional 27.7% |
| Immigrants | Ukraine | 98.6 /100 | #86 | Exceptional 27.7% |